

This is Part 6 of a series that walks through a growth equity fundraising deck. Eight slides cover four portfolio company case studies. We examine one investment in each of the four target sectors and highlight key value creation initiatives that drive ROI.
All the presentation data, analyses, and charts are available in the Microsoft Excel and PowerPoint files below:
If you need help or additional bandwidth for private equity marketing or track record projects like this, get in touch with me through the support page or my consulting website.
Sample Case Study
Case studies provide real-world examples of a firm’s investment and value creation strategies in action. When your audience is evaluating several comparable funds each day, it is not easy to make an investment strategy or value creation program appear differentiated. However, showing these concepts applied to real portfolio companies can make the narratives more credible and memorable.
There are many different ways to set up case studies. A major focus of this presentation is quantifying how various investment strategy and value creation elements drive ROI. Therefore, we dedicate two slides per company to allow extra space for supporting data and figures.
Vynix Case Study
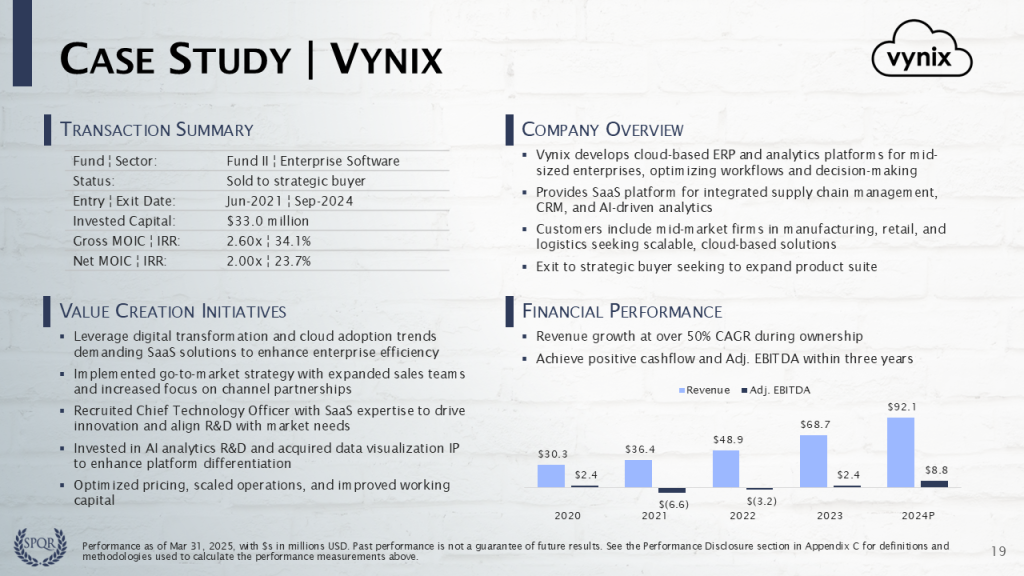
The first slide provides basic company details, returns, and financial performance. We see that Vynix is a Fund II software investment that was sold to a strategic buyer. Returns are respectable, but below-average for the firm’s exited investments. This is partly due to timing — it was acquired in 2021 when software valuations were frothy and sold in 2024 when they had returned to pre-COVID levels.
In addition to the headings above, case studies may include Investment Thesis or Exit sections. We touch on these elements under the Company Overview and Value Creation Initiatives headings to reserve more space for value creation content.
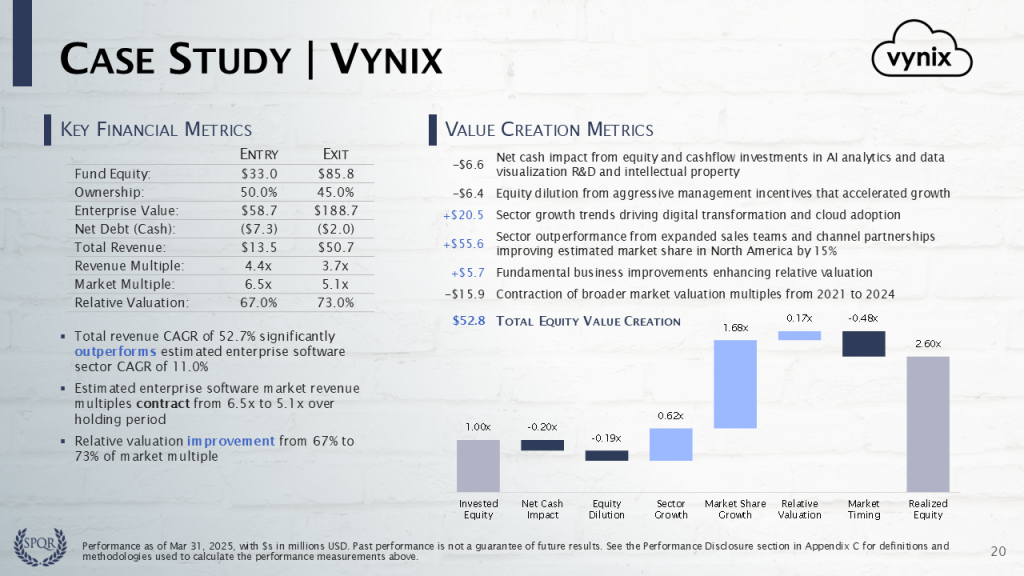
On the second slide, Key Financial Metrics on the left provide everything required to calculate the absolute ($) value creation measurements and the value bridge. Download one of the Excel templates to see this model in action. If necessary, visit the ValueBridge.net Modules for additional details on the math.
Invested equity of 1.00x reflects $33.0 million of fund equity deployed into Vynix.
Net cash impact of -0.20x measures cash that was burned to fund growth initiatives, like investments in AI analytics and acquisitions of data visualization IP, and the drag of excess cash on the balance sheet dampening equity gains, totaling -$6.6 million.
Equity dilution of -0.19x represents changes in GP ownership over the hold. The -$6.4 million loss reflects dilution from aggressive management incentives that were designed to accelerate growth.
Sector growth of +0.62x is the impact of secular tailwinds, based on the historical +11% software sector CAGR from 2021 through 2024. Since sector growth is core to the investment strategy, we argue that the GP should get credit for at least some of this +$20.5 million gain.
Market share growth of +1.68x comes from Vynix growing revenue significantly faster than sector peers. This is +$55.6 million of GP-driven value add that can be attributed to expanded sales teams and channel partnerships improving estimated market share in North America by 15%.
Relative valuation of +0.17x represents +$5.7 million of manager-specific multiple expansion from fundamental business improvements, since the company was acquired for 67% of the market valuation at entry and sold for 73% of the market valuation at exit.
Market timing of -0.48x represents -$15.9 million of broader-market multiple contraction, based on the historical sector revenue multiples 6.5x at entry and 5.1x at exit. We can estimate that without this value loss from market timing, the investment’s Gross MOIC would be +0.48x higher, or 3.08x.
Realized Equity of 2.60x is the Gross MOIC and represents the total return of $85.8 million, including a $33.0 million return of capital and $52.8 million of capital gains.
Please log in access additional content. Not a subscriber? Sign-up today!.
Comments are closed.