

This is Part 2 of a series that walks through a growth equity fundraising deck. The next three slides cover the Fund’s investment strategy, investment characteristics, and origination process.
All the presentation data, analyses, and charts are available in the Microsoft Excel and PowerPoint files below:
If you need help or additional bandwidth for private equity marketing or track record projects like this, get in touch with me through the support page or my consulting website.
Investment Strategy
The investment strategy section should explain the target portfolio company profile and anticipated avenues of value creation. This often includes some combination of target sectors or industries, company stage, investment size, position in the capital structure, geographic focus or coverage, resources provided to portfolio companies, risk mitigation efforts, exit strategies, P&L metrics or KPIs, and more.
Some strategy elements are restrictive – like only investing in businesses with 60%+ gross profit margins and recurring revenue. Others are more flexible – like seeking relatively low entry multiples by targeting investments in underserved regions or segments.
Audiences lose interest if you try to explain every aspect of the strategy, so focus on a handful of elements that have the most impact. These should be interesting, somewhat differentiated, easy to communicate, and – above all – demonstrably true. Validate and reinforce these elements as you proceed through the rest of the presentation, especially in the track record and case study sections.
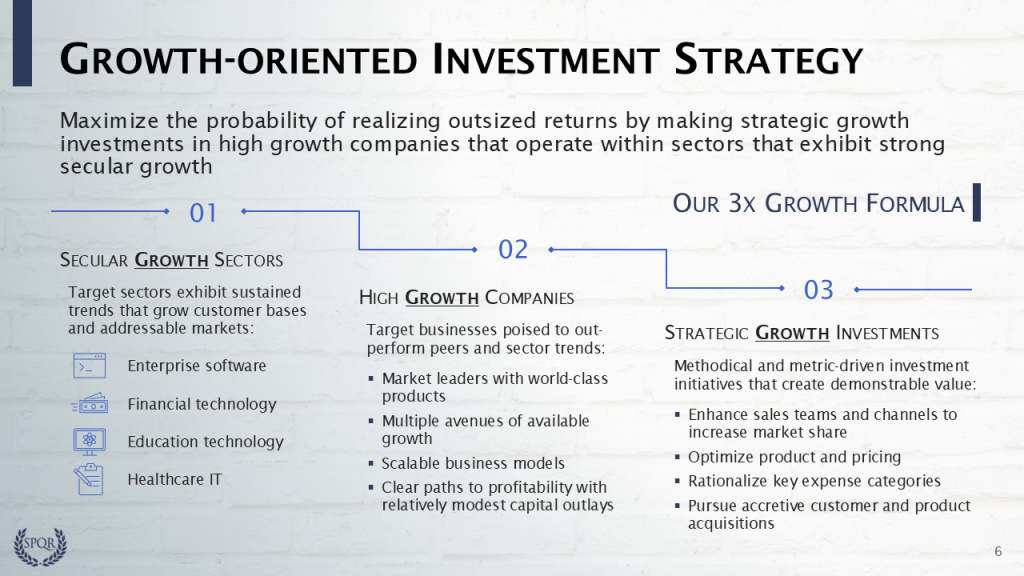
We summarize the investment strategy with the phrase 3x Growth Formula. While this subtly suggests a performance prediction, we simply mean that the word growth characterizes all three phases the approach. The firm targets:
- Secular growth sectors that provide positive tailwinds for investment returns
- High growth companies with the potential to outperform sector trends
- Strategic growth investments that create value in portfolio companies during the hold
Subsequent presentation sections reinforce these themes — see the Market Overview, Value Creation, and Case Study sections.
Investment Characteristics
Next we specify the target company size and equity check ranges, as well as P&L and capital structure parameters. These are forward looking targets for Fund IV, but the Fund III Average indicates that ranges are consistent with the most recent fund, so the firm is not moving up stream.
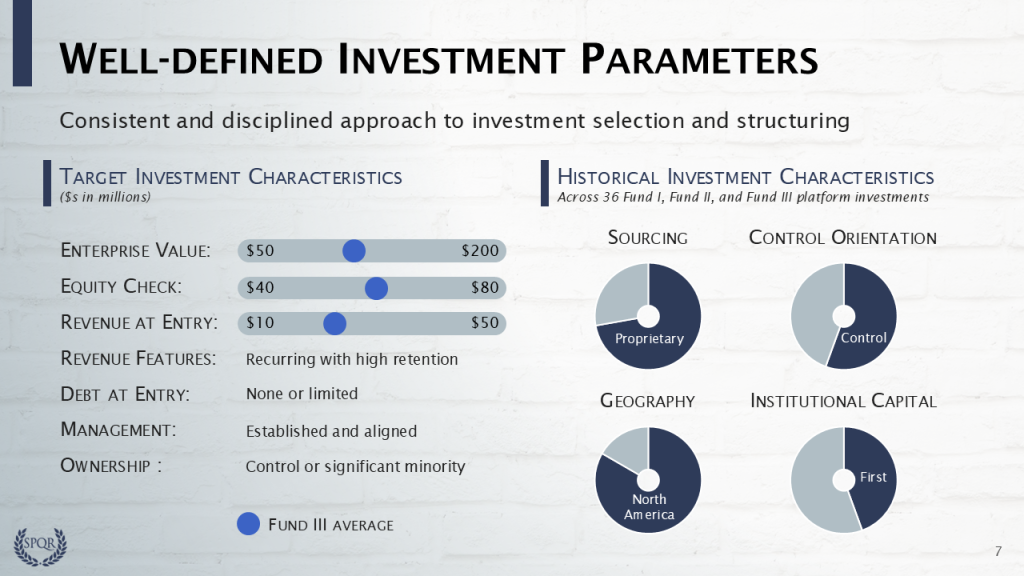
The historical investment characteristics on the right provide statistics about the current portfolio and suggest what audiences might expect from Fund IV going forward. Here we highlight that of the 36 platform investments in Fund I, Fund II, and Fund III:
- 26 came from proprietary sources (more on origination in the next slide)
- The firm had majority control positions in 20 investments
- 30 are headquartered in North America
- The firm was the first source of institutional capital in 16 investments
Please log in access additional content. Not a subscriber? Sign-up today!.
Comments are closed.