

This is Part 3 of a series that walks through a growth equity fundraising deck. Three market overview slides cover the Fund’s target investment sectors, as well as portfolio companies, capital deployment, and returns in each sector.
All the presentation data, analyses, and charts are available in the Microsoft Excel and PowerPoint files below:
If you need help or additional bandwidth for private equity marketing or track record projects like this, get in touch with me through the support page or my consulting website.
Target Investment Sectors
The market overview section should explain the fund’s investment landscape. These slides usually feature industry or market data from economic or research reports, and tend to imply the following:
- The firm focuses on areas where investment opportunities are abundant.
- The fund is well-positioned to execute because of competitive dynamics or the firm’s expertise.
- Market trends are favorable for continued execution and value creation over the hold.
For example, a smaller, generalist firm’s market overview may emphasize that 80-90% of the companies in a segment are under a certain size. The fund experiences less competition because private equity peers have moved upstream – they have raised larger funds and must pursue larger investments. These former competitors are now potential buyers that increase demand and drive up exit valuations.
Sector or industry specialists tend to highlight strong, secular trends in target segments and the relevant experience of investment professionals and operating executives. Their backgrounds provide unique insights into certain technologies, customer behaviors, or the regulatory and policy environment, and this impacts all phases of the investment process. It provides an edge in sourcing, capturing, monitoring, value creation, and exiting.
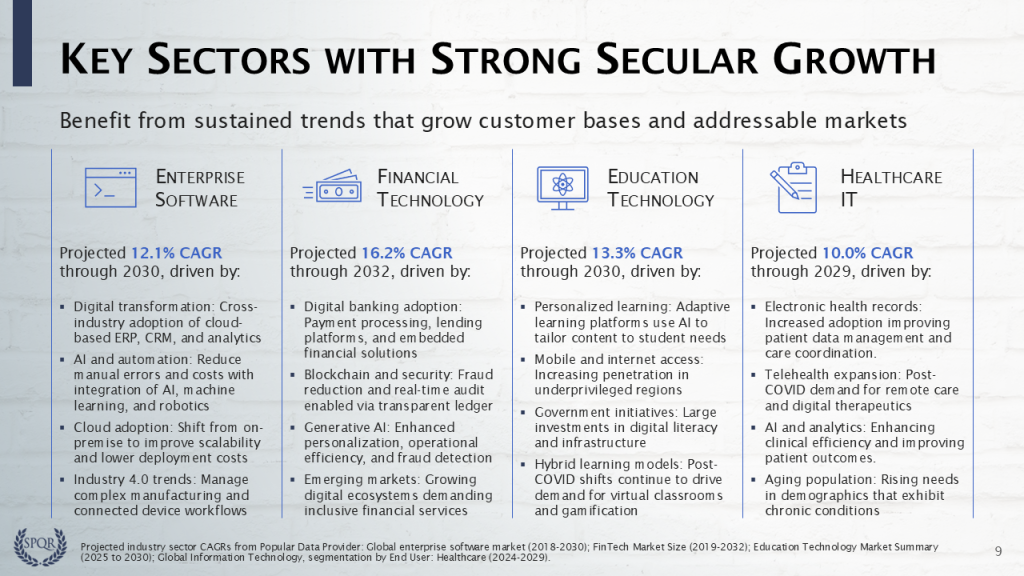
This market overview focuses on the firm’s four target sectors: enterprise software, financial technology, education technology, and healthcare IT. Projected sector growth rates, taken from industry research reports, imply sustained positive tailwinds that will help to enhance returns. We highlight a few relevant macro trends that are driving secular growth in each segment.
Here is something different!
In the Excel template, we actually quantify the impact of sector growth in each portfolio company’s return. We estimate that sector growth makes up 39% of total equity value creation in the 15 exited investments, and we will highlight this in the value creation strategy and case study slides.
Many GPs would be reluctant to point out that so much ROI was driven by broader market forces. Here, we lean into the fact because (1) most portfolio companies have grown revenue faster than the sector CAGRs and (2) the fund remains focused on the segments, so audiences might assume that existing and future investments will continue to benefit from these trends.
Sector Activity
Make sure to illustrate that the firm’s investment activities are consistent with the market overview detailed above. Here we point out that firm made 36 investments and deployed $1.4 billion of fund capital into the four target sectors.
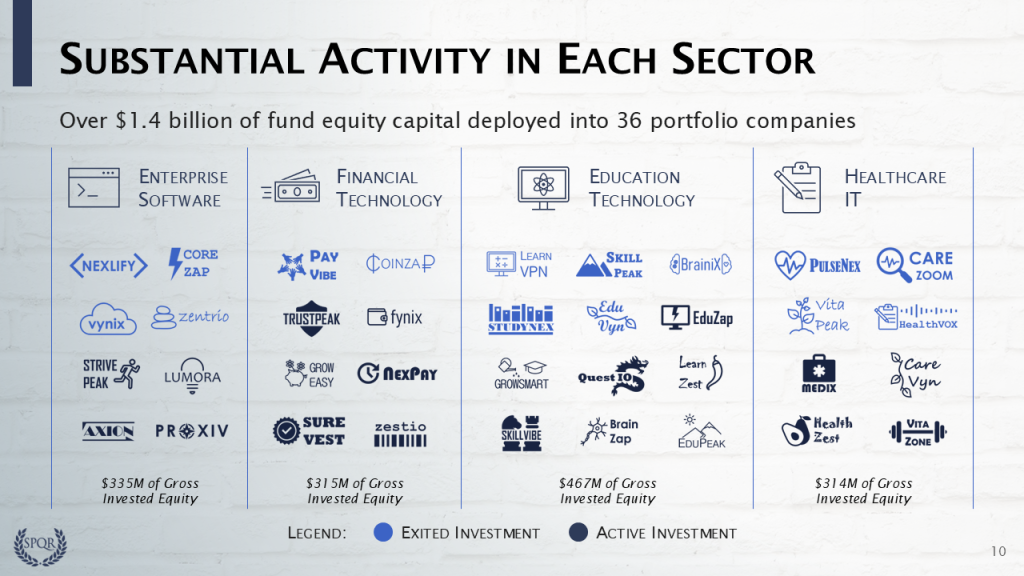
The slide highlights significant activity in each of the four segments, with each including at least eight portfolio companies, $300 million of gross invested equity, and multiple exits. Next we consider the returns generated in each sector…
Please log in access additional content. Not a subscriber? Sign-up today!.
Comments are closed.