

This is Part 5 of a series that walks through a growth equity fundraising deck. Three track record slides cover gross and net returns for funds, sectors, and individual deals, as well as TVPI and DPI comparisons to median and top-quartile benchmarks.
All the presentation data, analyses, and charts are available in the Microsoft Excel and PowerPoint files below:
If you need help or additional bandwidth for private equity marketing or track record projects like this, get in touch with me through the support page or my consulting website.
Realized Track Record
We highlight realized returns since inception in the Introduction, and then the total Gross and Net IRRs for each sector in the Market Overview. Hopefully, this is enough track record content to keep audiences from flipping forward to this section before you have a chance to introduce your team and explain the distinctive elements of your investment and value creation strategy.
Since the prior slide covers the firm’s efforts to maximize transaction values at exit, we chose to start with a figure that highlights Gross and Net MOICs for exits in each of the four target sectors.
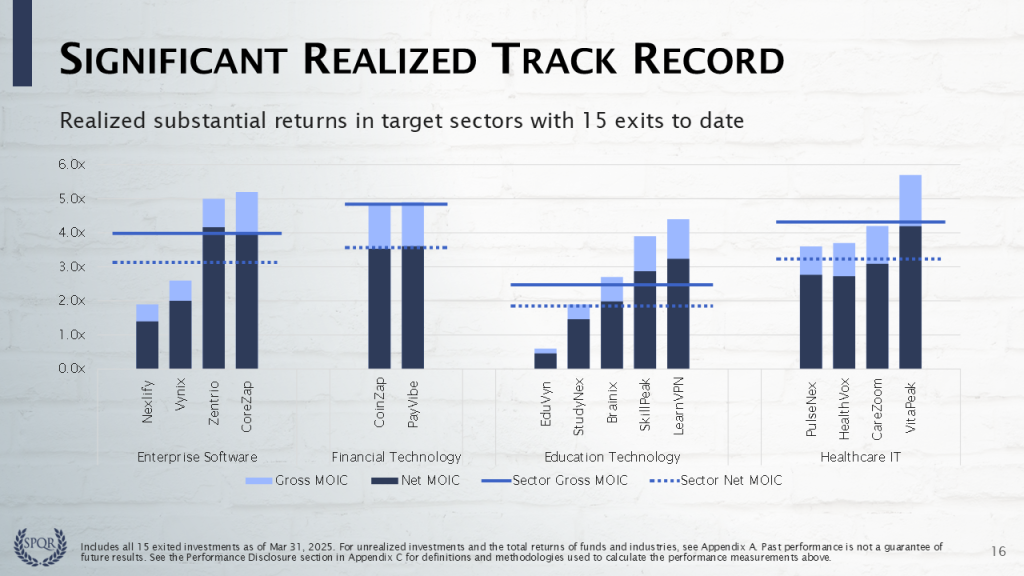
This figure quickly communicates several impressive elements of the track record to date:
- These are not paper gains – a portfolio of this size with 15 exits is substantially realized
- Realizations are well distributed across key sectors, with at least two exits in each
- Each sector has generated an impressive realized Gross and Net MOIC
- 10 of the 15 exits have Gross MOICs over 3.00x
- Only one exit is realized below cost
Note that these deal and sector MOICs are all “Extracted Performance”, as defined by the SEC’s Marketing Rule 206(4)-1. Since the exits do not comprise a dedicated fund with its own management fees, expenses, and carried interest, the Net MOICs require a hypothetical model. Download one of the Excel templates for our model and learn about the methodology in Module 01 or in the Net Return series at auxiliamath.com.
Total Track Record
The firm’s overall track record is provided on the next slide. For a firm at this stage and size, you would present total returns for each fund (at minimum). Total returns for Fund I, Fund II, and Fund III are highlighted in light blue. We chose to combine these track records into the All Funds – Total, displayed at the bottom of the table.
Note that the Invested, Realized, Unrealized, and Total columns exclude management fees, fund expenses, and carried interest, as do the Gross MOICs and Gross IRRs. Net MOICs and Net IRRs, which include fees, expenses, and carry, are displayed with equal prominence to comply with the Marketing Rule.
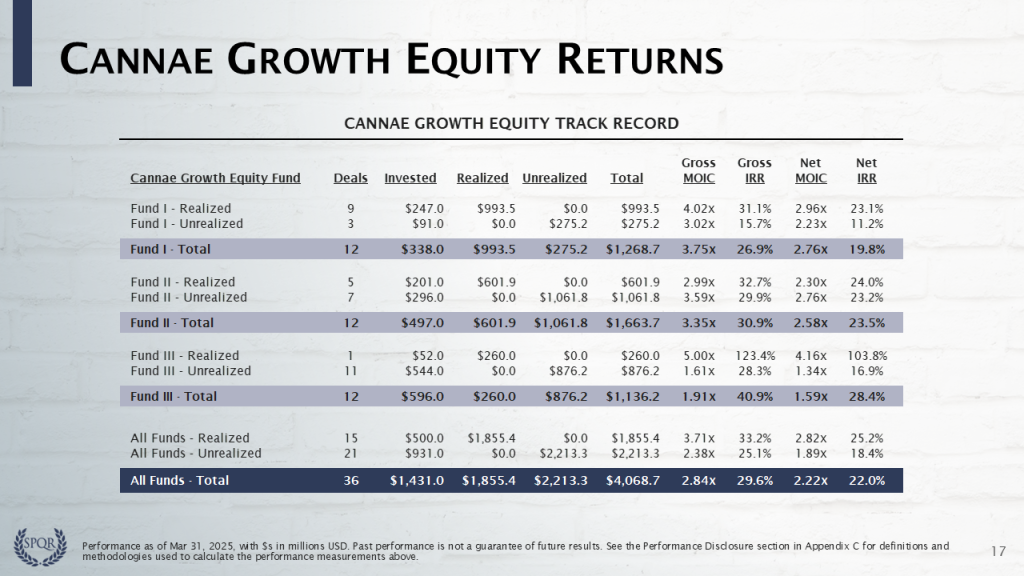
We also chose to highlight the returns of both the realized and unrealized cohorts within each fund. Note that the All Funds – Realized line matches the “Realized Returns since Inception” presented on the first content slide, in the Introduction.
Realized cohorts usually have higher MOICs because the unrealized portfolio companies are still working through value creation initiatives. This is why you typically see a trend of decreasing MOICs in more recent funds. Here, the Total Gross MOIC is 2.76x for Fund I (75% realized), 2.58x for Fund II (42% realized), and 1.59x for Fund III (8% realized).
IRR measurements tend to inherently correct for this, because they place less emphasis on the later investments. The fact that Total Gross IRR increases from 26.9% for Fund I, to 30.9% for Fund II, to 40.9% for Fund III suggests faster equity value creation in the later funds — perhaps due to improving value creation efforts or broader sector or market trends.
The footnote explains that all the table’s terms, and the methodologies behind them, are described in the Performance Disclosure section (Appendix C). Because realized and unrealized cohorts are Extracted Performance, they require a hypothetical track record model. Download one of the Excel templates for our model and learn about the methodology in Module 01 or in the Net Return series at auxiliamath.com.
Next, it would be appropriate to show the detailed fund track record slides that include each portfolio company investment’s MOICs and IRRs. Since we are already near the end of the main presentation body, we decided to move these tables to Appendix A. Instead, we will follow with Case Studies for four portfolio companies – one for each of the four target sectors.
Before we do that, however, let’s show how these returns compare to median and top-quartile benchmarks for each fund’s vintage…
Please log in access additional content. Not a subscriber? Sign-up today!.
Comments are closed.