

This is Part 4 of a series that walks through a growth equity fundraising deck. Four value creation slides cover strategy, the return drivers in 15 exited portfolio companies, and efforts to maximize transaction values at exit.
All the presentation data, analyses, and charts are available in the Microsoft Excel and PowerPoint files below:
If you need help or additional bandwidth for private equity marketing or track record projects like this, get in touch with me through the support page or my consulting website.
Value Creation Strategy
The value creation section explains how the fund endeavors to drive portfolio growth and maximize returns. This can include some combination of enhancing the board and management team, accelerating revenue, leveraging best practices and technologies to improve products, services, or processes, facilitating acquisitions or partnerships, and more.
As with the investment strategy, audiences lose interest if you try to explain every aspect of the playbook. Focus on a handful of elements that have significant impact. These should be interesting, somewhat differentiated, easy to communicate, and – above all – demonstrably true. Validate and reinforce these elements as you proceed through the rest of the presentation.
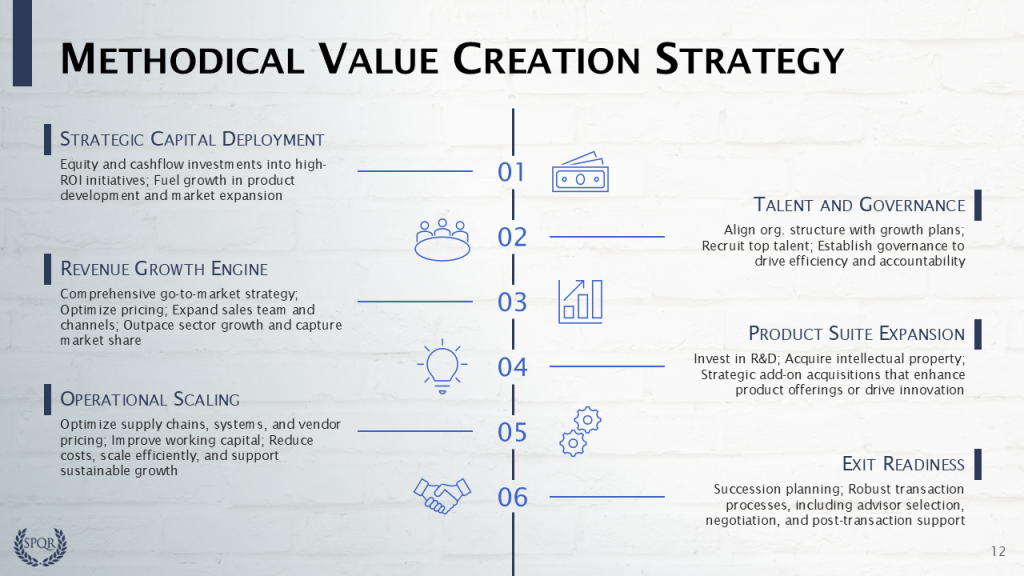
Here is a basic 6-step value creation process that could apply to many growth equity funds. It is not particularly differentiated, but we will try to make it more interesting by tying initiatives to changes in portfolio company financials and valuations that drive ROI.
01 Strategic capital deployment reflects cash burned to fund growth initiative and the drag of excess cash on the balance sheet dampening equity gains. It typically generates a negative value driver that we define as net cash impact.
02 Talent and governance is important, but its impact on equity ROI is hard to quantify, we so excluded from the value bridge.
03 Revenue growth engine accelerates top-line growth, especially the manager-driven component that we define as market share growth.
04 Product suite expansion should drive both revenue growth and the relative value of the revenue stream, measured via multiple expansion.
05 Operational scaling can improve gross profit margins and SG&A. When valuations are EBITDA-based, we can measure the impact in EBITDA margin expansion, gross margin expansion, and operating margin reduction. Since our growth equity fund’s valuations are revenue-based, we’ll mainly see the impact in multiple expansion.
06 Exit readiness includes efforts to maximize transaction values at exit, which will be evident in multiple expansion.
A Value Creation Bridge
The 15 exited investments return 3.71x gross invested capital. We calculate value drivers for each portfolio company and then combined them to produce a value bridge for the realized portfolio. The chart’s units are Times Money value creation, where absolute ($) value creation is scaled to Invested Equity in all 15 deals. Download one of the Excel templates to see this model in action.
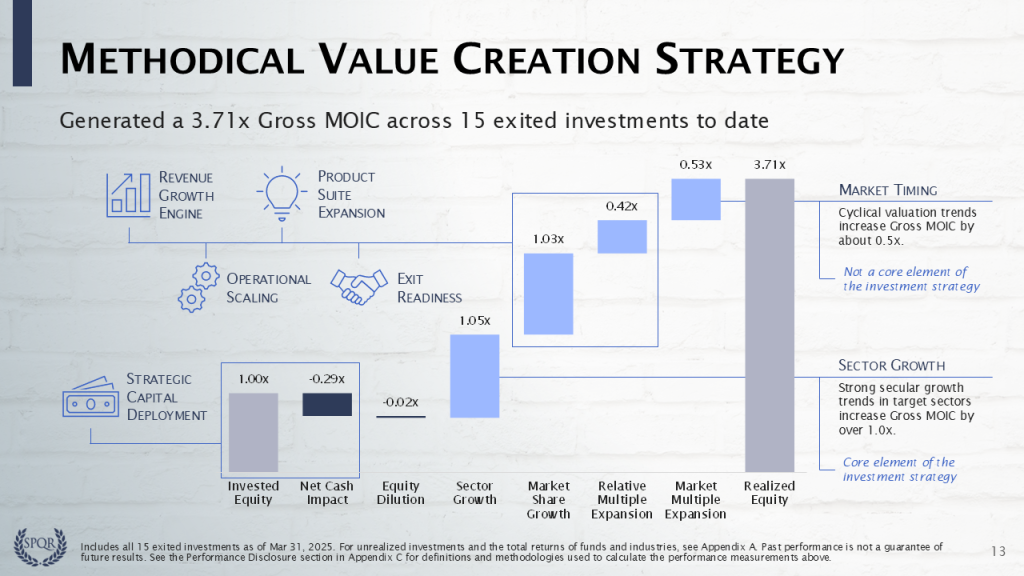
Invested Equity of 1.00x reflects $500 million of fund capital deployed into the 15 portfolio companies.
Net cash impact of -0.29x measures net cash that was burned to fund growth initiatives and the drag of excess cash on the balance sheet dampening equity gains (-$145 million). We tie this value driver to the Strategic Capital Deployment initiative. Learn how to quantify it in Module 09. Gearing and Cashflow in a Growth Investment.
Equity dilution of -0.02x represents changes in GP ownership over the hold (-$10 million). Security features like participating preference can create gains, but dilution from management option pools can generate losses. It is generally a minor value driver, so we do not tie it to any particular initiative. Learn how to measure it in Module 02. Equity Dilution and Equity Concentration.
Sector growth of +1.05x is the impact of secular tailwinds (+$525 million), based on historical sector growth rates from 2015 through 2025. Since sector growth is core to this GP’s investment strategy, we think that they should get credit for it. We have already shown that projected sector growth is expected to perform as well as historical rates, so Fund IV should continue to benefit from this dynamic. It generates a full turn of capital gains on Invested Equity in the exited portfolio.
Market share growth of +1.03x comes from the 15 companies generally growing revenue faster than their sector peers (+$513 million). This is GP-driven value add that can be attributed to the Revenue Growth Engine and Product Suite Expansion initiatives. It generates a full turn of capital gains on Invested Equity in the exited portfolio.
Learn how to quantify these growth drivers in Module 05. Revenue Growth and Revenue Multiple Expansion and Module 15. Market-driven Revenue Growth.
Relative multiple expansion of +0.42x quantifies the manager-specific causes of multiple expansion (+$209 million), like buying at relatively low multiples (proprietary sourcing), selling at relatively high multiples (exit readiness or strategic buyer), accretive asset acquisitions, professionalizing businesses, and improving the quality of revenue or EBITDA streams. It is another GP-driven component that may be attributed to Product Suite Expansion, Operational Scaling, and Exit Readiness initiatives.
Market-multiple expansion of +0.53x is basically market timing (+$263 million), based on historical sector revenue multiples from 2015 through 2025. It is not core to the investment strategy, but it does impact returns. We can estimate that without this additional value generated from market timing, the portfolio’s Gross MOIC would be 0.53x lower, or 3.18x.
Learn how to measure these valuation drivers in Module 05. Revenue Growth and Revenue Multiple Expansion and Module 13. Market-driven Multiple Expansion.
Realized Equity of 3.71x is the Gross MOIC and represents the total return of $1,855 million, including a $500 million return of capital and $1,355 million of capital gains.
Relative (%) Value Creation
The 15 exited investments produce $1.355 billion of equity value creation, which can be attributed to the same value drivers above. Here we divide absolute ($) value creation by capital gains to determine relative (%) value creation for each component.
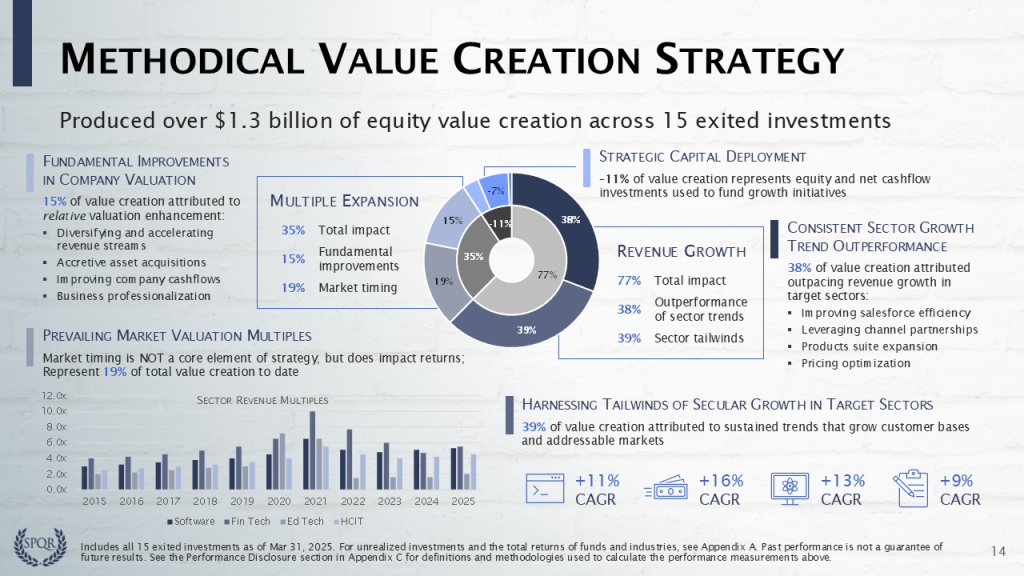
This is a two-layer pie chart, where the inner donut represents a simplified value bridge with which audiences may be more familiar. The inner donut illustrates that:
- +77% of equity value creation comes from revenue growth (+$1,039 million)
- +35% of equity value creation comes from multiple expansion (+$471 million)
- -11% of equity value creation comes from capital structure changes (-$155 million)
We want to preclude the notion that multiple expansion just represents market timing or luck. The outer donut illustrates that revenue growth and multiple expansion both have market-driven and manager-specific causes.
Market-driven revenue growth represents 39% of equity value creation and comes from the sector CAGRs of 11% for enterprise software, 16% for financial technology, 13% for education technology, and 9% for healthcare IT.
Outperforming sector revenue explains 38% of equity value creation, due to improvements in salesforce efficiency, leveraging channel partnerships, product suite expansion, pricing optimization, and more.
Market-driven multiple expansion represents 19% of equity value creation and is based on the sector revenue multiples in the chart. The data exhibits a market valuation spike that certainly enhances value creation for any businesses sold between 2020 and 2022, but may reduce value creation for companies acquired during the period.
Outperforming the sector valuations explains 15% of equity value creation. It suggests a consistent pattern of improving business fundamentals, irrespective of fluctuations in market revenue multiples. Relative multiple expansion is measured from changes in a portfolio company’s discount to the market multiple, and will be illustrated in the next slide and the Case Studies.
Capital structure changes consume -11% of equity value creation and include net cash that was burned to fund growth initiatives, the drag of excess cash on the balance sheet dampening equity gains, and equity dilution.
Please log in access additional content. Not a subscriber? Sign-up today!.
Comments are closed.