How do you measure value creation in buy-and-build or roll-up strategies? This is where you start with a platform investment and then make several add-on or bolt-on acquisitions that increase the size of the business and, hopefully, create value.
Establishing the Buy-and-Build or Roll-up Starting Point
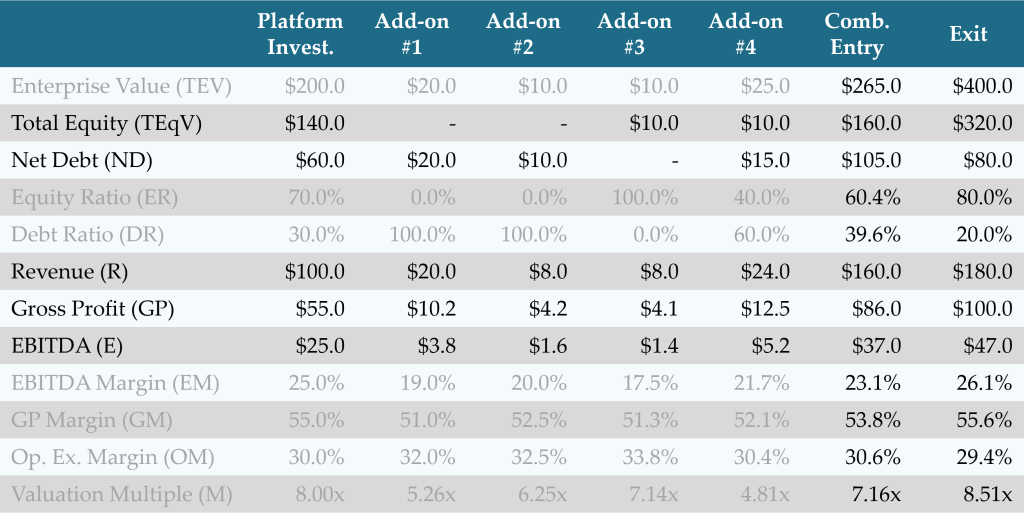
The initial platform is a $200 company that’s funded with $140 of equity and $60 of debt, so its equity and debt ratios are 70% and 30%, respectively. It has TTM revenue of $100, gross profit of $55, and EBITDA of $25. This makes its EBITDA margin 25%, gross profit margin 55%, and operating expense margin 30%. The valuation multiple is 8.00x from the $200 enterprise value divided by $25 million of TTM EBITDA.
This roll-up includes four add-on acquisitions. The general idea is that these acquired companies are not as valuable or well-run as the private equity-backed platform, but can be improved through integration into a larger, more efficient, and more competitive entity.
For example, the add-on financials are worse, with lower EBITDA margins, lower gross profit margins, and higher operating expense margins. But this can be fixed through economies of scale. Overhead reductions and purchasing discounts can create cost synergies. Shared resources and centralizing offices can create operational efficiencies.
Multiple arbitrage should also be achieved, as smaller add-ons generally have lower valuations compared to larger and more established companies. Additionally, over time, revenue synergies, increased market power, and lower costs of capital might be expected.
The value creation starting point is the combination of the platform and four add-on acquisitions, which are financed as follows:
- Add-on #1: $20 of debt financing
- Add-on #2: $10 of cash from the platform company’s balance sheet
- Add-on #3: $10 of additional equity invested by shareholders
- add-on #4: $10 of additional equity, $10 of debt, and $5 of balance sheet cash
See Module 30. Add-on Acquisitions and Module 35. Multiple Holding Period Inflows and Outflows for more detail about the combination of multiple add-on acquisitions.
Value Creation in Buy-and-Build or Roll-up Strategies
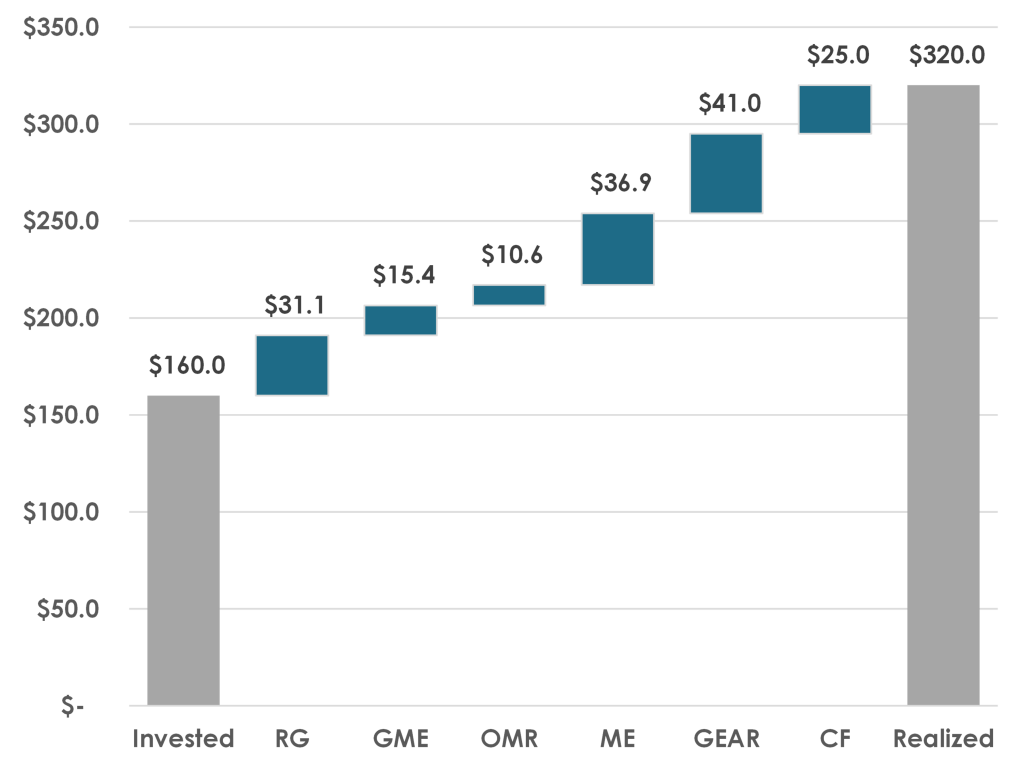
Ultimately the company is sold for $400. Prior to exit, the company pays net debt down to $80, which leaves equity proceeds of $320 million. This is a 2.00x return on the $160 million of total equity that was invested in the initial platform and in the third and fourth add-on acquisitions.
Only the two columns on the right are needed to calculate what drove value in this buy-and-build strategy. For the Derivative model, first measure the absolute change in each metric and then take the average of the entry and exit value, as follows:
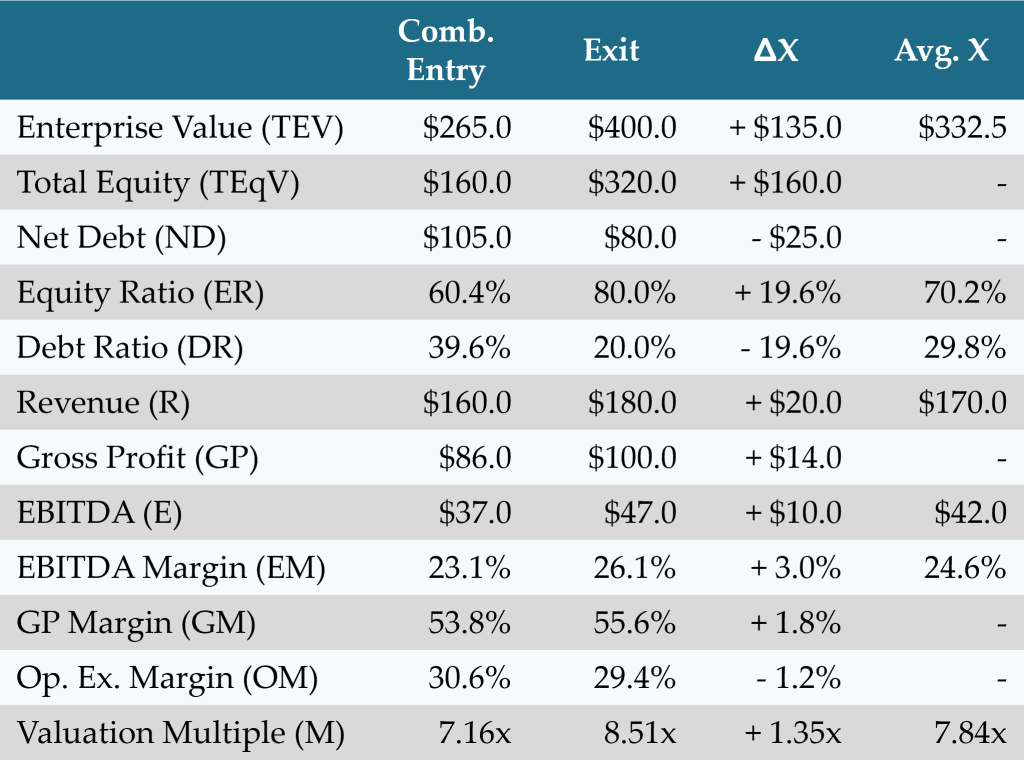
These metrics may be plugged into the value creation equations to measure absolute ($) equity value creation driven by Revenue Growth (VRG), Gross Margin Expansion (VGME), Operating Margin Reduction (VOMR), Multiple Expansion (VME), Gearing (VGEAR), and Cashflow Generation (VCF):
![]()
![]()
![]()
![]()
![]()
![]()
The six value drivers add up to $160, which precisely bridges the gap between the invested equity of $160 and the realized equity of $320.
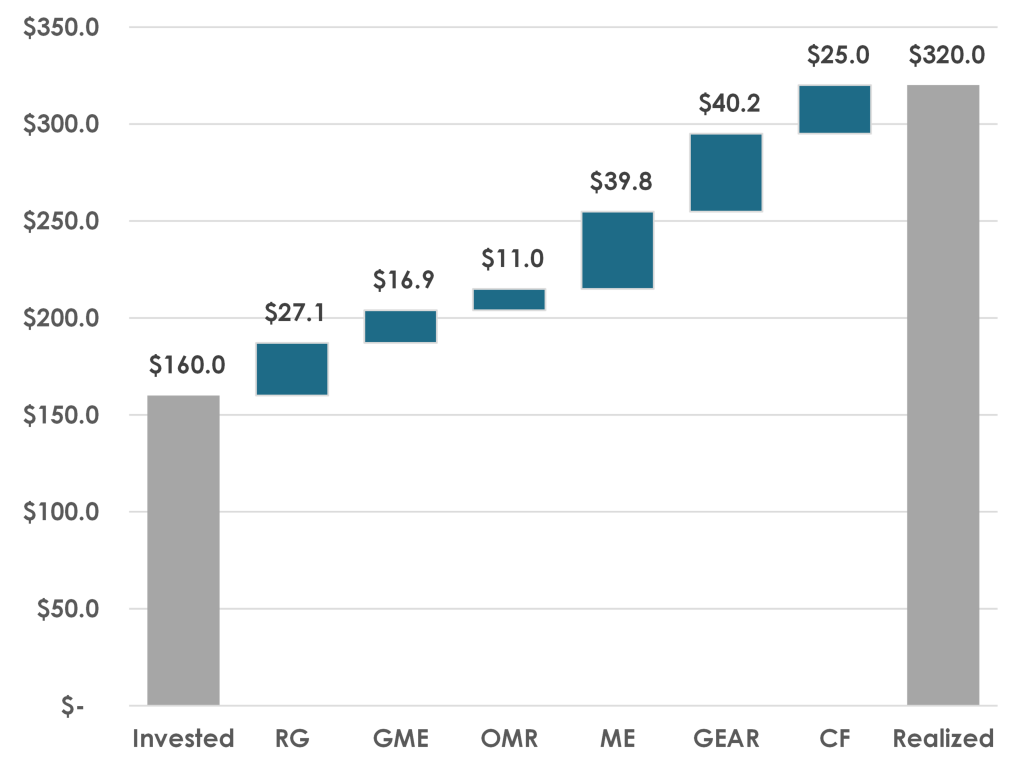
This is a complete explanation of equity value creation in the deal. It requires no other adjustments. However, some analysts try to calculate how much value comes from “inorganic” or M&A-driven factors. This can be estimated by defining a “hypothetical platform baseline” that represents the individual acquired businesses immediately benefiting from the valuation and resources provided by the platform.
Step 1: Value Creation to a Hypothetical Platform Baseline
If the acquired businesses all had gross profit margins of 55% and EBITDA margins of 25%, and total revenue remained at $160, then gross profit would increase to $88 and EBITDA would increase to $40. At 8.00x, this represents an enterprise valuation of $320. Since combined net debt is $105, total equity would increase to $315.
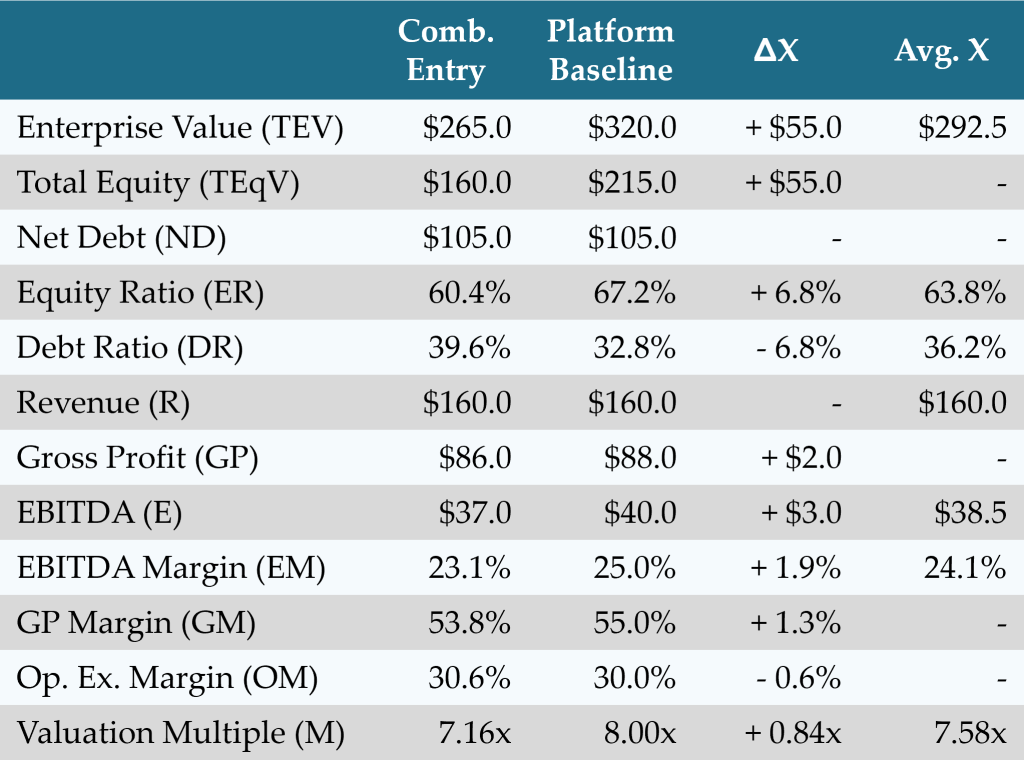
Those assumptions suggest that the combination immediately generates $55 of equity value creation. Plugging these capital structure and P&L metrics into the value creation equations provide:
![]()
![]()
![]()
![]()
![]()
![]()
These six value drivers add up to $55, which precisely bridges the gap between the invested equity of $160 and the realized equity of $215.
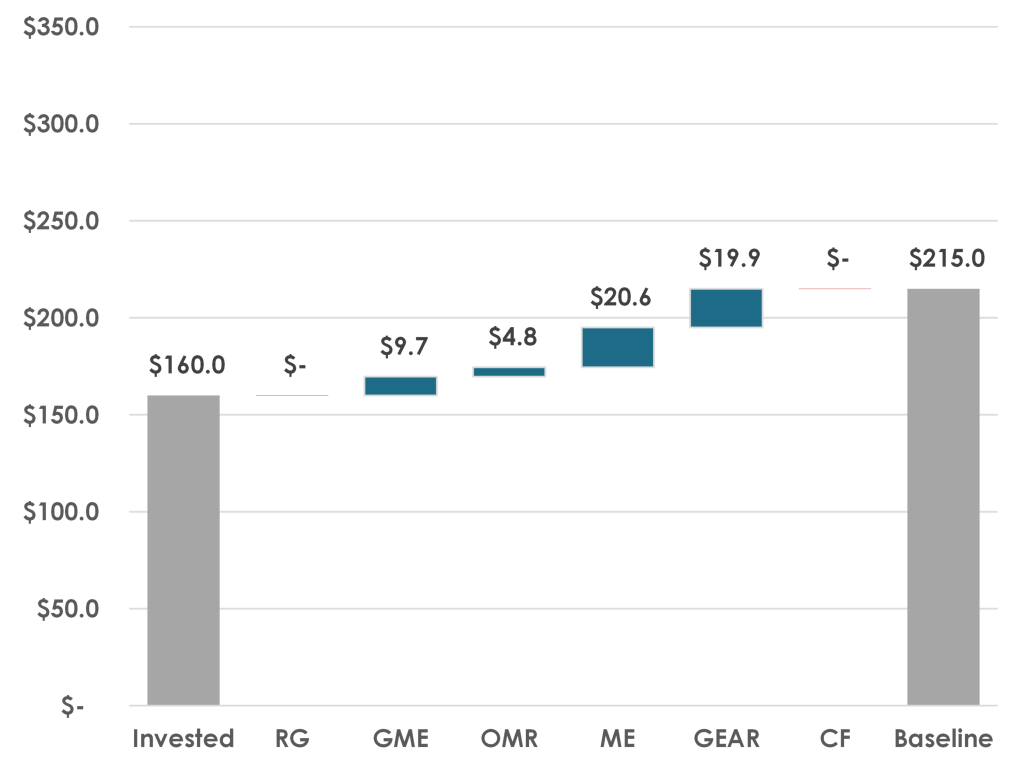
Step 2: Value Creation after the Hypothetical Platform Baseline
Next, measure value creation from this hypothetical platform baseline to exit.
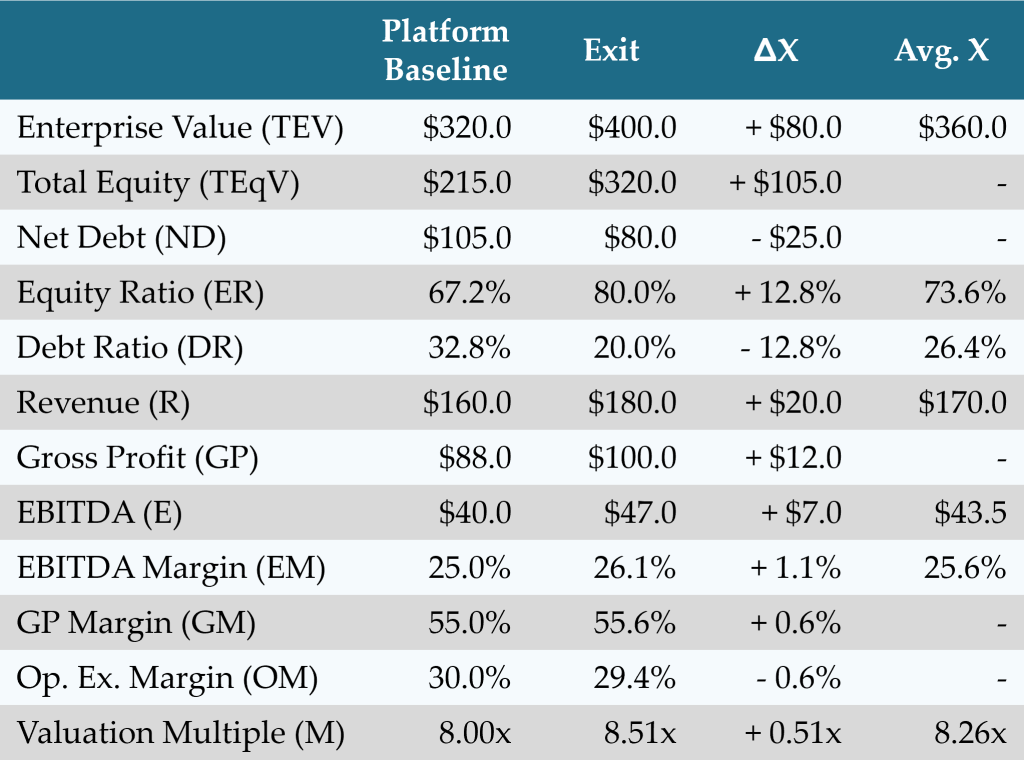
Step 2 generates $105 of equity value creation, and plugging these capital structure and P&L metrics into the value creation equations provides:
![]()
![]()
![]()
![]()
![]()
![]()
These six value drivers add up to $105, which precisely bridges the gap between the invested equity of $215 and the realized equity of $320.
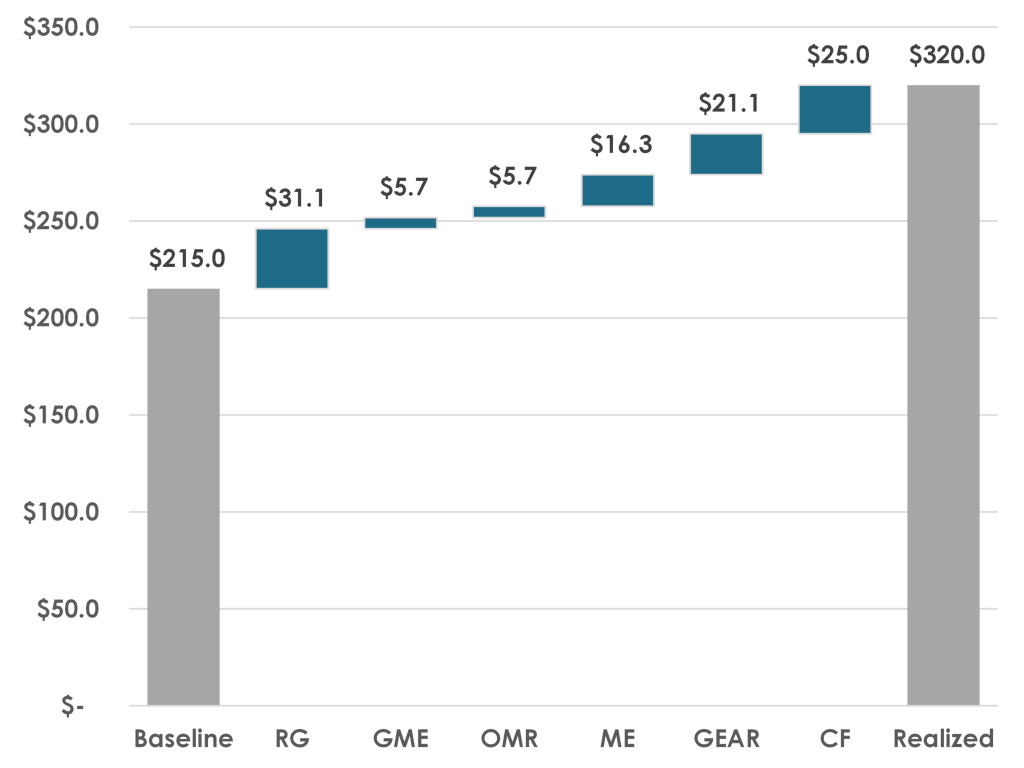
Total Value Creation in Buy-and-Build or Roll-up Strategies
If the hypothetical platform baseline assumptions above are reasonable and meaningful, then the “inorganic” or M&A step (Step 1) drives 35% of equity value creation and the “organic” or operational step (Step 2) drives 65% of equity value creation. Combining the value drivers in Step1 and Step 2 produce similar results to what are achieved in the first (One Step) value creation model.
Step 1 + Step 2
One Step

In this case, all the value drivers look reasonable and all the numbers sum to the correct totals. It suggests that the hypothetical platform baseline above is probably a reasonable proxy for reality. But note that the platform margin and valuation assumptions were entirely subjective. Other choices will provide different results, which may not be as meaningful.
Please log in access additional content. Not a subscriber? Sign-up today!.
