Value Creation in Private Equity

Your paint-by-numbers resource for value creation in private equity deals, funds, investment managers, and institutional investment programs.

What is a value bridge?

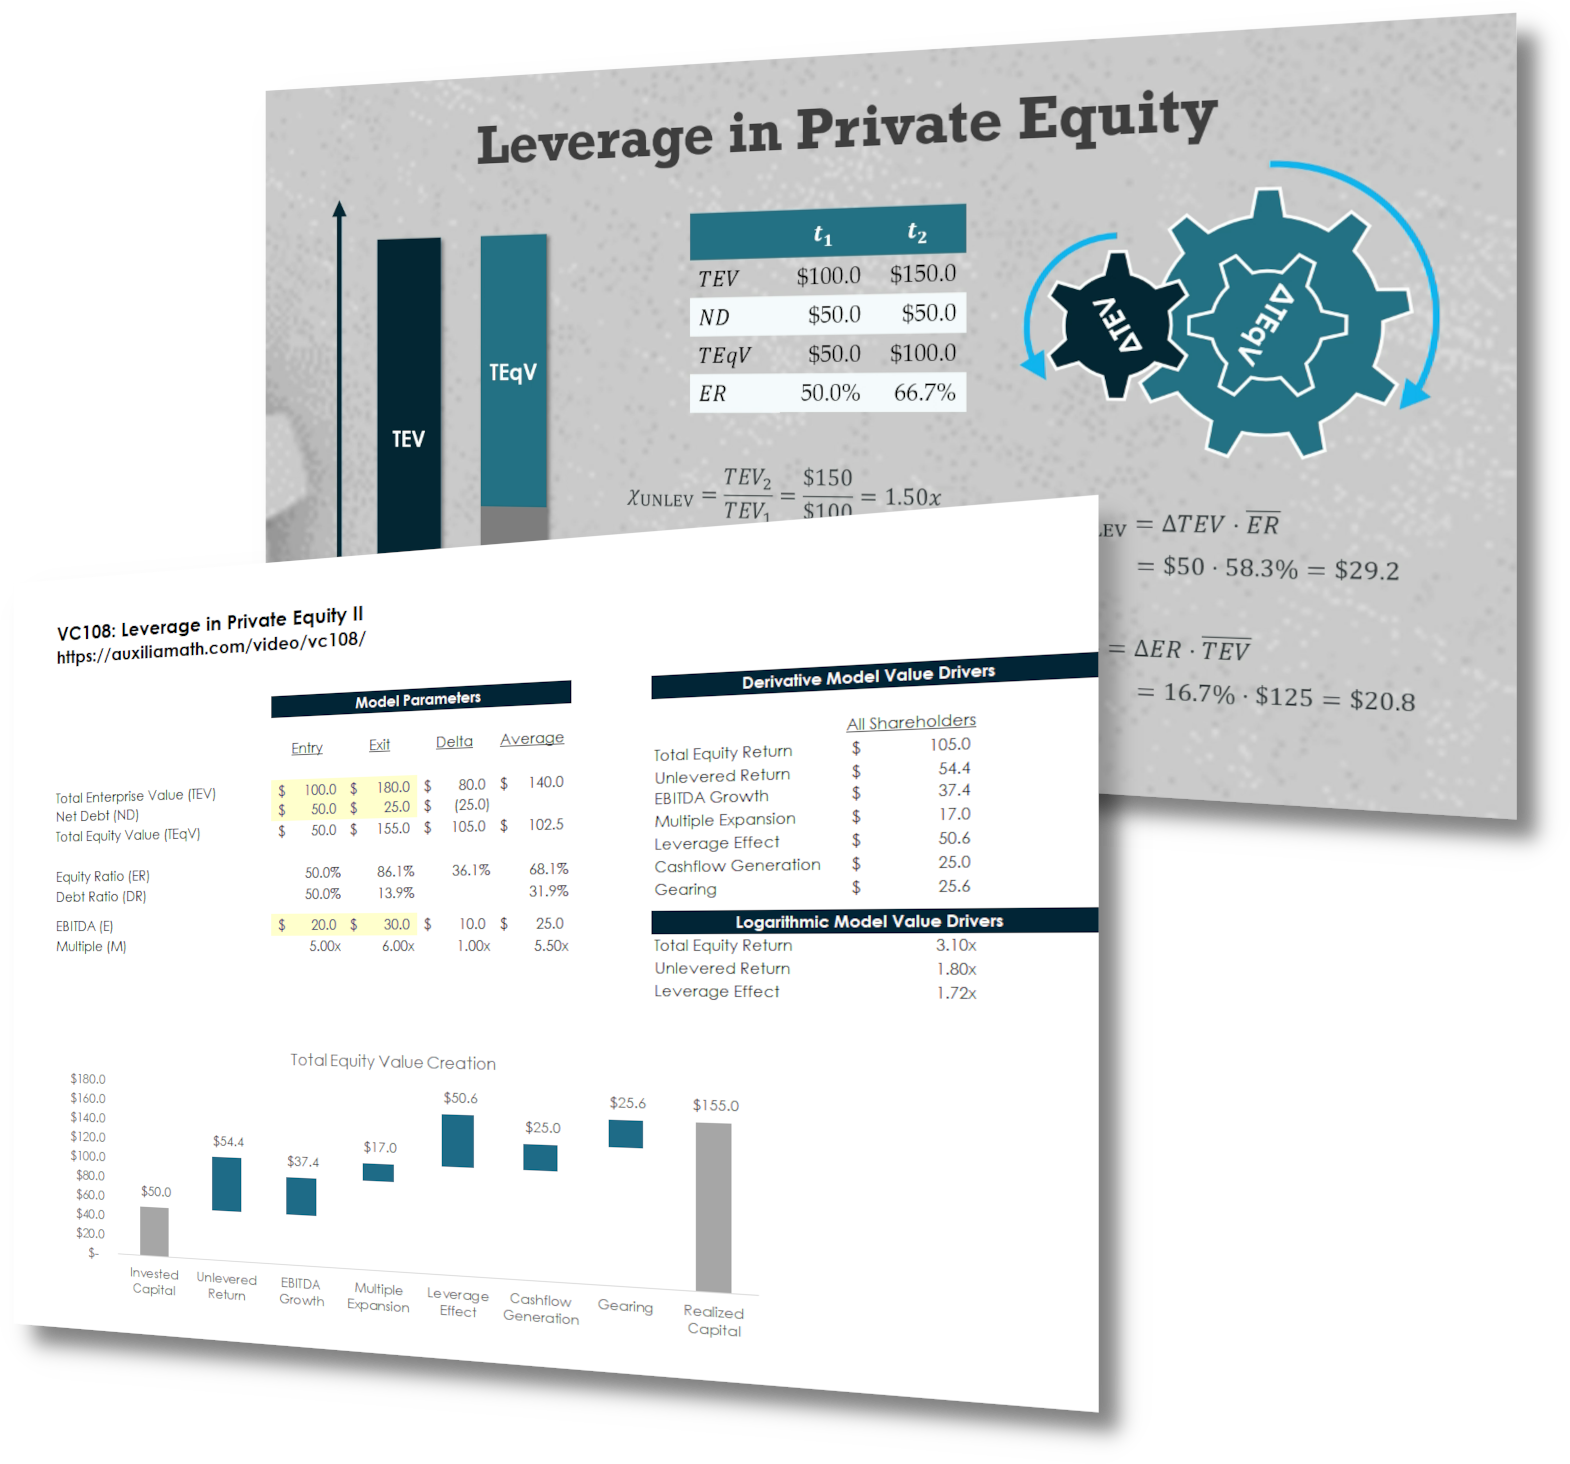
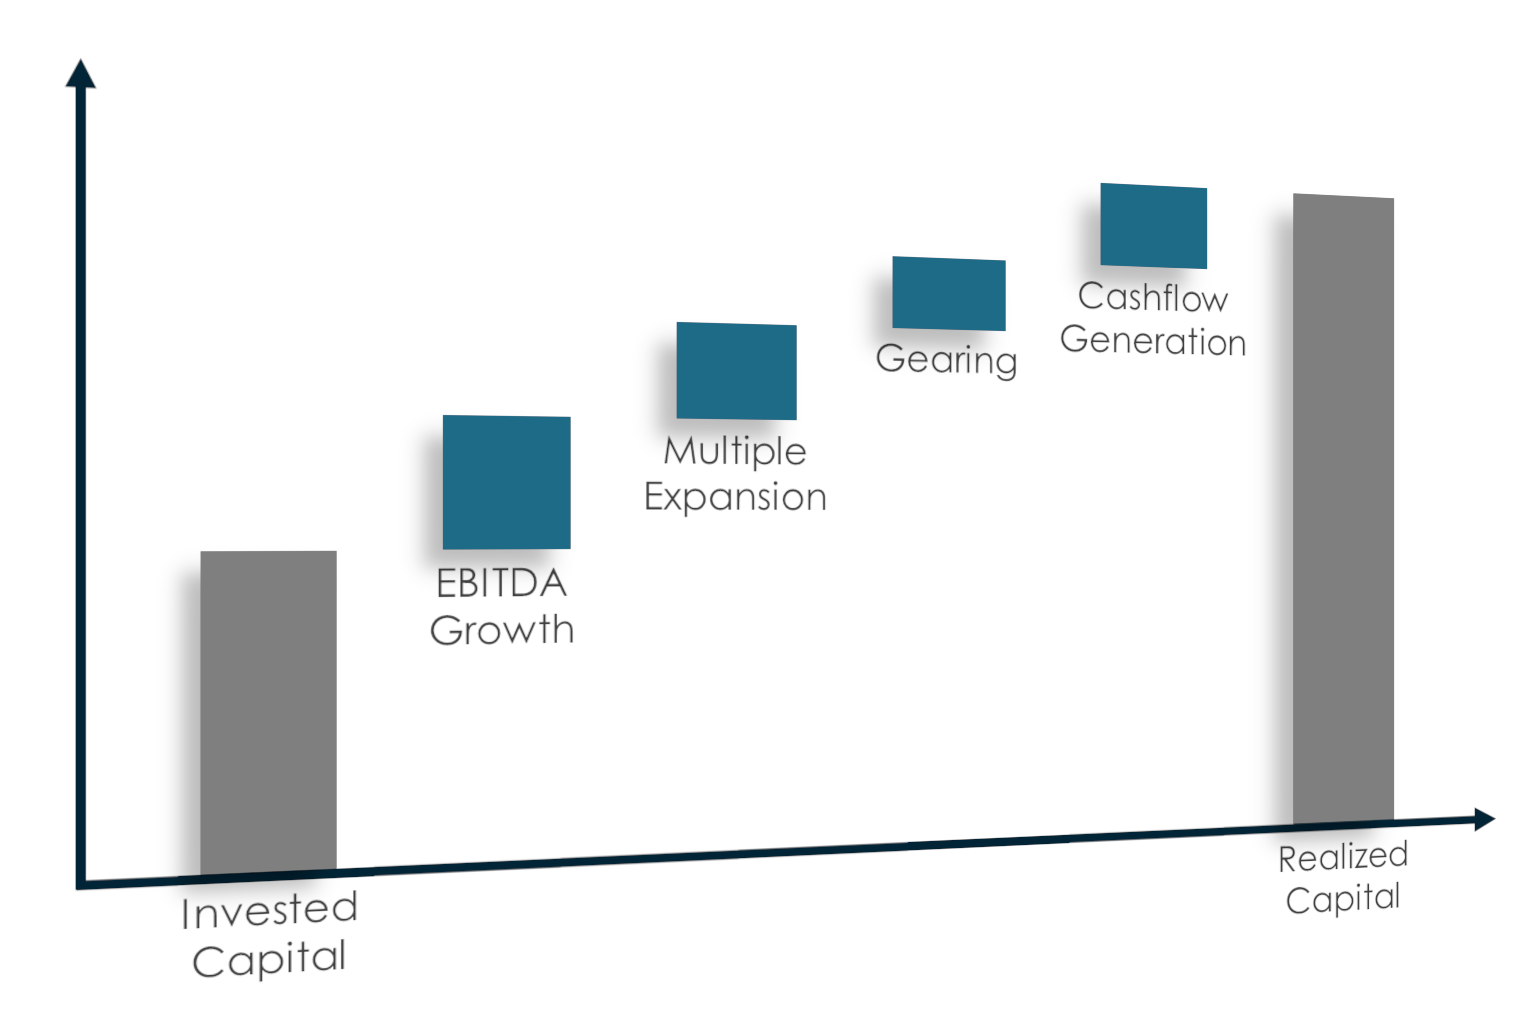
Value bridges explain how private equity returns are driven by changes in portfolio company P&Ls, capital structures, and market conditions. They are used by GPs to demonstrate investment strategies or operational capabilities, LPs to measure manager value-add, and academics to understand broader industry trends.

Despite 20 years of use in the industry, value bridge models utilized by GPs, LPs, and academics mostly fail. Their results are inconsistent and volatile, and they do not properly measure the impact of leverage and growth capital in private equity deals.

We proved that there is a better way

Adding a touch of Calculus 101 to the private equity portfolio company’s capital structure and P&L provides a robust mathematical framework that can be reliably applied to almost any deal. The math works for investments that are levered or unlevered, buyout or growth, majority or minority, 10x or 0.1x. Best of all, the models run on numbers already available in fund reporting and marketing materials.

We wrote a book about value bridges in 2020. Private Equity Value Creation Analysis is a top private equity book on Amazon.com. We also discuss these models extensively on our private equity mathematics website, AUXILIA Mathematica, and its companion YouTube page. There you’ll find detailed proofs and comparisons with other models in academic and industry literature, as well free Microsoft Excel templates.

Visit AUXILIA
Mathematica
Watch the
Videos
Buy the
Book

Start building value bridges, today

You came to the right place if you need a defensible model up and running by close of business. Here, we exclude academic theories and mathematical proofs to provide just what’s essential to meet your deadline. Each of the 40 modules describes exactly which equations to use, where to find your numbers, and how to set up your spreadsheets.

No more guesswork!

All modules include short video demonstrations, downloadable Microsoft Excel templates, detailed notes and references, and online calculators that help you check your own models for errors. ValueBridge.net allows you build confidently, knowing your analyses will withstand scrutiny from the most inquisitive antagonists, whether they be your managing directors, limited partners, regulators, or the state treasurer.

SHORT VIDEO DEMONSTRATIONS

Learn exactly which equations to use, where to find data, and how to set up your spreadsheets, all in about 5-6 minutes.

MICROSOFT EXCEL TEMPLATES

Save time by starting with pre-built Microsoft Excel templates that are already optimized for your application.

ONLINE CALCULATORS

Ensure that your models are correct by checking against the site’s fail-proof online value creation calculators.

DETAILED NOTES AND REFERENCES

Build confidently by following step-by-step examples with clearly defined variables and equations.

Available Now!

Full access to available video instruction, Excel templates, online calculators, module notes, references, case studies, community forums, and support. 

Check Content Status

Pragmatic solutions to 40 private equity problems

Dive right into the module that best fits your situation or watch them all sequentially to thoroughly master the private equity value bridge.

01. Net MOIC and Net IRR

Calculate Net Returns from the Gross MOIC and Gross IRR and estimates for Management Fee, Fund Expense, and Carried Interest.

Free Access to Module 01


02. Equity Dilution and Equity Concentration

Measure how GP equity returns are influenced by capital raising, management option pools, and stock types (e.g., participating preferred).

03. Unlevered Return and the Leverage Effect

The right way to quantify how debt and growth capital influence private equity returns.

04. EBITDA Growth and EBITDA Multiple Expansion

How much of a private equity return is driven by changes in EBITDA (assuming an EBITDA-based valuation).

05. Revenue Growth and Revenue Multiple Expansion

How much of a private equity return is driven by changes in revenue (assuming a revenue-based valuation).

06. Dependent and Independent Variables

The right way to set up Excel spreadsheets for the value creation models in this series.

07. Five ways to Measure Private Equity Returns

Measure private equity value driver as absolute ($) value creation, relative (%) value creation, times money value creation, equity return multipliers, and value creation IRRs.

08. Gearing and Cashflow in an LBO

Quantify the impact of cashflow and debt’s amplification of equity gains (and losses) in levered investments.

09. Gearing and Cashflow in a Growth Investment

Quantify the impact of cashflow and growth capital’s dampening of equity gains (and losses) in growth or expansion investments.

10. Interest Costs and Debt Tax Shield

Estimate the impact of interest payments on a levered private equity investment.

11. Revenue Growth and EBITDA Margin Expansion

Given an EBITDA-based valuation, how much value is driven by changes in top-line revenue and EBITDA margin on the company’s P&L.

12. Gross Margin Expansion and Operating Margin Reduction

Given an EBITDA-based valuation, how much value is driven by changes in COGS and SG&A on the company’s P&L.

13. Market-driven Multiple Expansion

Separate the market and manager-driven factors behind valuation to calculate Market Multiple Expansion and Intrinsic Multiple Expansion.

14. Market Multiple Data Sources

Suggestions for building effective market valuation multiple datasets.

15. Market-driven Revenue Growth

Separate the market and manager-driven factors behind revenue to calculate Addressable Market Growth and Market Share Growth.

16. Addressable Market Data Sources

Suggestions for building effective addressable market value datasets.

17. Sector-appropriate Gearing

Measure how much of the return was driven by a private equity deal having more (or less) leverage than the typical public or family-held peer.

18. Other Market Drivers

Measurements of market influence on company EBITDA margin, COGS, and SG&A can be interesting, but are generally less reliable.

19. Market versus Manager-driven Returns

Simple market and manager-driven return measurements that can be more meaningful and easier to calculate than PME.

20. The Market Return Matrix

The fastest way to benchmark private equity deals by industry or sector and estimate GP value-add.

21. Foreign Exchange Rates

Measuring value drivers when the portfolio company’s native currency is different from the GP or LP.

22. Five Mistakes that GPs Make

How private equity GPs tend to shift value creation from categories like Revenue Growth and EBITDA Growth into Multiple Expansion.

23. Acquisition Adjustments (I)

The right way to set up entry metrics, given transaction fees, expenses, working capital, and cash.

24. Acquisition Adjustments (II)

More on entry adjustments, including rollover equity, seller notes, and acquired liabilities.

25. Exit Adjustments (I)

The right way set up exit metrics, given the various fund flows among buyers, sellers, lenders, bankers, and other parties.

26. Exit Adjustments (II)

More on exit adjustments and the impact of cash holdbacks and escrows. 

27. Holding Period Inflows and Outflows

The right way to address the transactional events that occur during the holding period of a private equity investment.

28. Equity Infusions

Adjust entry metrics for follow-on equity investments used to fund operations or acquire assets.

29. Equity Distributions

Adjust exit metrics for prior distributions generated from operating cash flows or the sale of assets.

30. Add-on Acquisitions

Adjust entry metrics for the acquisition of operating entities that make incremental changes to the company’s effective balance sheet and P&L.

31. Divestments

Adjust exit metrics for the divestment of operating entities that make incremental changes to the company’s effective balance sheet and P&L.

32. Debt Refinancings

Adjust entry and exit metrics for transaction-driven changes in debt levels during a holding period.

33. Dividend Recapitalizations

Adjust entry and exit metrics for equity distributions generated from changes in a company debt levels.

34. Earn Outs

The right way to handle a contingent earn out at either entry or exit.

35. Multiple Holding Period Inflows and Outflows

How to handle and investment with more than one equity infusion, distribution, add-on acquisition, divestment, refinancing, or dividend recapitalization.

36. The Effective IRR

Estimate Internal Rates of Return without burdensome cash flow spreadsheets.

37. Value Creation over Time

Monitor value driver changes quarter-to-quarter to identify inflection points.

38. Value Creation across Valuation Domains

Calculate performance and valuation-driven equity changes despite evolving valuation metrics (i.e., going from pre-revenue to a revenue multiple to an EBITDA multiple).

39. Aggregate Value Creation across Portfolios

How to measure aggregate drivers of equity value creation for across portfolios, Funds, and investment programs.

40. Net Return-based Value Drivers

Measure value drivers like EBITDA Growth and Multiple Expansion in the Net Return domain, after the impact of GP Management Fees, Fund Expenses, and Carried Interest.