

Measure GP value-add after the impact of market multiples, addressable markets, and foreign exchange rates in a cross border value bridge.
Private equity value creation measurements can be robust, repeatable, and defensible. This includes broader market forces, which can often be estimated from datasets that are available for little or no cost. This case study includes a cross border value bridge, where market drivers are measured from investment banking publications, economic data, and foreign exchange rates.
Consider an institutional Limited Partner based in the US. They invest in a private equity Fund manager based in Europe. The Fund makes a portfolio investment that is based in Spain.
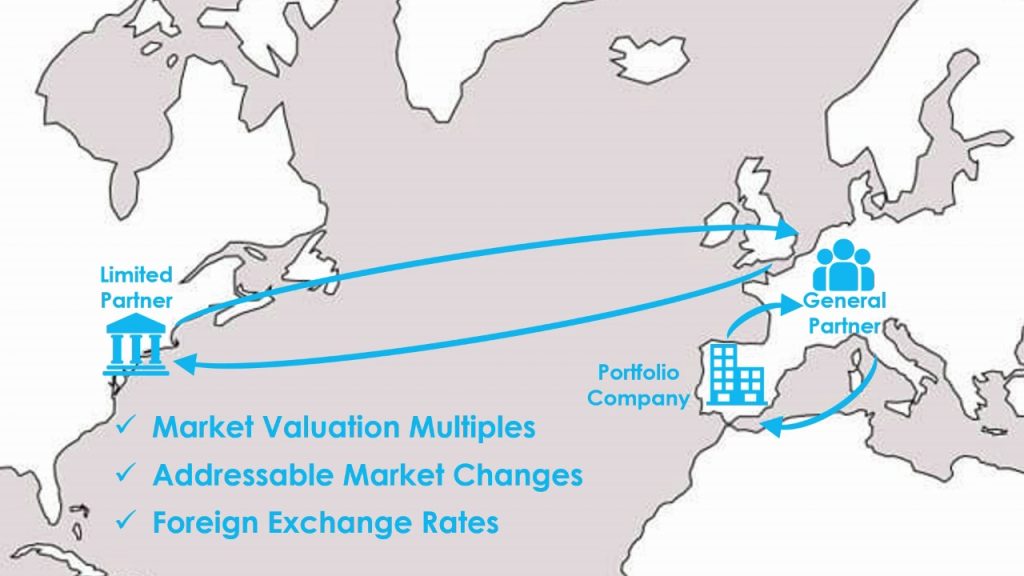
In the Fund’s reporting materials, all return and portfolio company metrics are measured in EUR, but the LP wants to know what those numbers mean in its native currency of USD. They would also like to separate GP value-add from other market drivers, like changes in market valuation multiples and the company’s addressable market.
This Case Study demonstrates how to do that, using datasets that are widely available for little or no cost. While the datasets in this example may not be relevant to your deals, it is the framework that matters. You can plug in the data points that are most relevant to your sectors and geographies, and generate a highly refined picture of a Fund manager or management company’s value-add.
Market Data for a Cross Border Value Bridge
Market Valuation Multiples
Because private equity GPs and LPs talk about market multiple all the time, there are numerous sources that can be filtered by company size, industry, and geography. Many analysts consult services like Pitchbook and GF Data.
Investment banks also publish relevant data, like this July 2023 Global M&A Quarterly from R.W. Baird. According to page 13, Europe Middle-Market Enterprise Value to Median EBITDA Multiples contracted from 8.4x in 2018 to 8.0x in 2022.
You can sign up to receive reports like this by email on the R.W. Baird website: https://www.rwbaird.com/corporations-and-institutions/investment-banking/reports/
Addressable Market Data
Whenever companies grow revenue faster than an addressable market, their share of that market increases. These relative changes can separate Revenue Growth into broader-market and company specific causes.
Analysts can use macro-economic metrics as a proxy for addressable markets, or finely tune them to the portfolio company’s sector, geography, or niche. This case study simply uses Spain’s GDP as a proxy for the addressable market, so a company that grows faster than the economy will gain market share, and one that grows more slowly than the economy will lose market share.
Data provided by the St. Louis Federal Reserve suggests that Spain’s economy grew from € 305,818 million at entry to € 350,088 million at exit, representing a 14.48% increase over the hold.
Eurostat, Gross Domestic Product for Spain [CPMNACSCAB1GQES], retrieved from FRED, Federal Reserve Bank of St. Louis; https://fred.stlouisfed.org/series/CPMNACSCAB1GQES
Foreign Exchange Data
Foreign exchange conversions should be made when capital flows between the Fund and the portfolio company, not when capital flows between the LP and the Fund.
This is a practical matter. It is almost impossible to precisely trace these capital flows, even when a Fund and LP use the same currency. They are obscured by too many Fund-level factors, like the use of Fund credit facilities, recycling, management fee offsets, different LPs having different terms and capital call requirements, etc.
Thus, we must estimate LP capital flows as if capital is called whenever portfolio investments are made and Fund distributions occur for every portfolio company realization. The required data is available on many finance websites, such as Yahoo! Finance. As noted in Module 21, always use the FX rate where the Fund’s currency is the “base” currency. In this case, it is quoted as EURUSD and describes how many USD are required or returned for each EUR (counterintuitively, the units for a EURUSD quote are actually USD/EUR).
Value Creation Metrics
In this case study, the transaction include a €100 million platform investment that was made in September 2018 and a €24 million add-on acquisition in March 2020. Realizations include a €20 million distribution from the company’s balance sheet prior to the sale of the business at 6.00x its TTM EBITDA of €30 million in September of 2022.
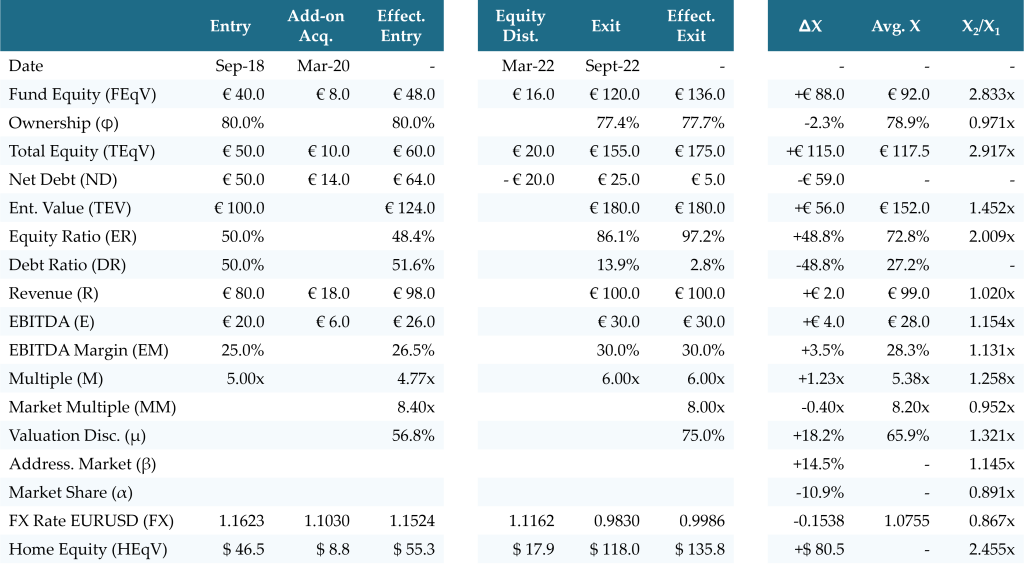
The strengthening of USD over the holding period clearly has a material impact this cross border value bridge.
- In the Fund’s native currency, the investment returns €136.0 on €48.0, or a Gross MOIC of 2.833x.
- In the Limited Partner’s native currency, the investment returns $135.6 on $55.3, or a Gross MOIC of 2.455x.
This difference can be quantified through the value creation components below.
Value Creation Measurements
Equity value creation in USD may be measured as Addressable Market Growth (VAMG), Market Share Growth (VMSG), EBITDA Margin Expansion (VEME), Market Multiple Expansion (VMME), Intrinsic Multiple Expansion (VIME), Gearing (VGEAR), Cashflow Generation (VCF), Fund Ownership Impact (VFO), and Foreign Exchange Impact (VFX), with the following equations:
![\[ V_{AMG} = \frac{\beta}{2} \left( R_1 + \frac{R_2}{1+\beta} \right) \cdot \overline{EM} \cdot \overline{M} \cdot \overline{ER} \cdot \overline{\phi} \cdot \overline{FX} \]](https://valuebridge.net/wp-content/ql-cache/quicklatex.com-a5dd66719d84f7a80fe75ecf3b40e4ac_l3.png "Rendered by QuickLaTeX.com")
![\[ = \frac{+14.5\%}{2} \left( 98 \in + \frac{100 \in}{1+14.5\%} \right) \cdot 28.3 \% \cdot 5.38x \cdot 72.8 \% \cdot 78.9 \% \cdot 1.0755^{USD}_{\overline{EUR}} = + \$ 12.61 \]](https://valuebridge.net/wp-content/ql-cache/quicklatex.com-5abaec5cc520211f864e8b4539db5fc0_l3.png "Rendered by QuickLaTeX.com")
![\[ V_{MSG} = \frac{\alpha}{2} \left( R_1 + \frac{R_2}{1+\alpha} \right) \cdot \overline{EM} \cdot \overline{M} \cdot \overline{ER} \cdot \overline{\phi} \cdot \overline{FX} \]](https://valuebridge.net/wp-content/ql-cache/quicklatex.com-4f8e644d38c9d74789ee5b3d6d9b314a_l3.png "Rendered by QuickLaTeX.com")
![\[ = \frac{-10.9\%}{2} \left( 98 \in + \frac{100 \in}{1-10.9\%} \right) \cdot 28.3 \% \cdot 5.38x \cdot 72.8 \% \cdot 78.9 \% \cdot 1.0755^{USD}_{\overline{EUR}} = - \$ 10.73 \]](https://valuebridge.net/wp-content/ql-cache/quicklatex.com-5214e651c031fed5a8f5e31b8a1387cf_l3.png "Rendered by QuickLaTeX.com")
![\[ V_{EME} = \Delta EM \cdot \overline{R} \cdot \overline{M} \cdot \overline{ER} \cdot \overline{\phi} \cdot \overline{FX} \]](https://valuebridge.net/wp-content/ql-cache/quicklatex.com-3056f539a2a643183e359961ee27fb91_l3.png "Rendered by QuickLaTeX.com")
![\[ = + 3.5 \% \cdot 99.0 \in \cdot 5.38x \cdot 72.8 \% \cdot 78.9 \% \cdot 1.0755^{USD}_{\overline{EUR}} = + \$ 11.42 \]](https://valuebridge.net/wp-content/ql-cache/quicklatex.com-55c673f829a6caebdd5aecc34ba77d63_l3.png "Rendered by QuickLaTeX.com")
![\[ V_{MME} = \Delta MM \cdot \overline{\mu} \cdot \overline{E} \cdot \overline{ER} \cdot \overline{\phi} \cdot \overline{FX} \]](https://valuebridge.net/wp-content/ql-cache/quicklatex.com-0a4965082435ab323dfed2ddc5709e01_l3.png "Rendered by QuickLaTeX.com")
![\[ = - 0.40x \cdot 65.9 \% \cdot 28.0 \in \cdot 72.8 \% \cdot 78.9 \% \cdot 1.0755^{USD}_{\overline{EUR}} = - \$ 4.56 \]](https://valuebridge.net/wp-content/ql-cache/quicklatex.com-179f69a0d4c6633354f4370fd0d50d92_l3.png "Rendered by QuickLaTeX.com")
![\[ V_{IME} = \Delta \mu \cdot \overline{MM} \cdot \overline{E} \cdot \overline{ER} \cdot \overline{\phi} \cdot \overline{FX} \]](https://valuebridge.net/wp-content/ql-cache/quicklatex.com-4ca8490911befb3a648e234f51b64f8a_l3.png "Rendered by QuickLaTeX.com")
![\[ = + 18.2 \% \cdot 8.20x \cdot 28.0 \in \cdot 72.8 \% \cdot 78.9 \% \cdot 1.0755^{USD}_{\overline{EUR}} = + \$ 25.84 \]](https://valuebridge.net/wp-content/ql-cache/quicklatex.com-11fe26454ec0f590bb1102e6527044c2_l3.png "Rendered by QuickLaTeX.com")
![\[ V_{GEAR} = \Delta TEV \cdot \overline{DR} \cdot \overline{\phi} \cdot \overline{FX} = + 56.0 \in \cdot 27.2 \% \cdot 78.9 \% \cdot 1.0755^{USD}_{\overline{EUR}} = + \$ 12.92 \]](https://valuebridge.net/wp-content/ql-cache/quicklatex.com-12b4c9804a1aedcca473129b5f817199_l3.png "Rendered by QuickLaTeX.com")
![\[ V_{CF} = - \Delta ND \cdot \overline{\phi} \cdot \overline{FX} = + 59.0 \in \cdot 78.9 \% \cdot 1.0755^{USD}_{\overline{EUR}} = + \$ 50.04 \]](https://valuebridge.net/wp-content/ql-cache/quicklatex.com-8fc3f968b5626dd58c2dc7ceaacd74dc_l3.png "Rendered by QuickLaTeX.com")
![\[ V_{FO} = \Delta \phi \cdot \overline{TEqV} \cdot \overline{FX} = - 2.3 \% \cdot 117.5 \in \cdot 1.0755^{USD}_{\overline{EUR}} = - \$ 2.89 \]](https://valuebridge.net/wp-content/ql-cache/quicklatex.com-9b602dadbf99264d7c5d5022e100323b_l3.png "Rendered by QuickLaTeX.com")
![\[ V_{FX} = \Delta FX \cdot \overline{FEqV} = -0.1538^{USD}_{\overline{EUR}} \cdot 92.0 \in = - \$ 14.15 \]](https://valuebridge.net/wp-content/ql-cache/quicklatex.com-2ccf4a6afb9bc48f45b7bf66813a87c9_l3.png "Rendered by QuickLaTeX.com")
Market-driven versus Manager-driven Return
After isolating the components of the cross border value bridge, value drivers can be recombined in any manner that the analyst sees fit. For example, it would be reasonable to reasonable to define the Market-driven Return (VMARKET) as the combination of Addressable Market Growth, Market Multiple Expansion, and Foreign Exchange Impact, as follows:
![\[ V_{MARKET} = V_{AMG} + V_{MME} + V_{FX} \]](https://valuebridge.net/wp-content/ql-cache/quicklatex.com-3709e92a996cfe4ca615af6500e3bc5f_l3.png "Rendered by QuickLaTeX.com")
![\[ = + \$ 12.61 - \$ 4.56 - \$ 14.15 = - \$ 6.09 \]](https://valuebridge.net/wp-content/ql-cache/quicklatex.com-9eb5b530373718ff3691c04b73526749_l3.png "Rendered by QuickLaTeX.com")
The Manager-driven Return (VMANAGER) can then be defined as the remaining value drivers, where:
![\[ V_{MANAGER} = \Delta HEqV - V_{MARKET} \]](https://valuebridge.net/wp-content/ql-cache/quicklatex.com-59030b7fb2dea5f66d46aad7da49d634_l3.png "Rendered by QuickLaTeX.com")
![\[ = + \$80.50 - \left( - \$6.09 \right) = + \$ 86.59 \]](https://valuebridge.net/wp-content/ql-cache/quicklatex.com-bd698ec0d3cb8347cd42370c5a2443da_l3.png "Rendered by QuickLaTeX.com")
The Manager-driven Return is about 8% higher than expected from the GP’s marketing or reporting materials, because it is achieved against market headwinds of strengthening US and contracting valuation multiples.
Value Creation IRRs
The Absolute ($) Value Creation measurements that make up a value bridge are sometimes criticized because they do not explicitly consider how much time or invested capital are required to generate the return. However, Module 07 shows that we can convert these value drivers to relative and time dependent measurements, like Value Creation IRRs, quite easily.
This particular investment has a Gross IRR of 32.20% in the Fund’s base currency (EUR). Therefore, the deal has an effective holding period (Δt’) of 3.731 years, where:
![\[ \Delta t' = \frac{\ln{\left( FEqV_2 / FEqV_1 \right) }}{ \ln{\left( 1 + Gross\,IRR \right) } } = \frac{\ln{\left( 2.833x \right)}}{\ln{\left( 1+32.20 \% \right)}} = 3.731 \, years \]](https://valuebridge.net/wp-content/ql-cache/quicklatex.com-4ac333971efc811f2ff61b9c1f4bf8bd_l3.png "Rendered by QuickLaTeX.com")
The effective hold allows us to measure the IRR in the home currency (IRRHOME), and also calculate the IRR that was driven by the market (IRRMARKET) and the manager (IRRMANAGER). , where:
![\[ IRR_{HOME} = \left( \frac{HEqV_2}{HEqV_1} \right)^{V_{HOME} / (\Delta HEqV \cdot \Delta t')} -1 = 2.455x^{\$ 80.50 / (\$ 80.50 \cdot 3.731)} -1 = + 27.22 \% \]](https://valuebridge.net/wp-content/ql-cache/quicklatex.com-4ff3f579d9bead0ab6d9e3c9a25564a6_l3.png "Rendered by QuickLaTeX.com")
![\[ IRR_{MARKET} = \left( \frac{HEqV_2}{HEqV_1} \right)^{V_{MARKET} / (\Delta HEqV \cdot \Delta t') } -1 = 2.455x^{-\$ 6.09 / (\$ 80.50 \cdot 3.731)} -1 = -1.81 \% \]](https://valuebridge.net/wp-content/ql-cache/quicklatex.com-1039d0500f0a984e56afc0513e3d9128_l3.png "Rendered by QuickLaTeX.com")
![\[ IRR_{MANAGER} = \left( \frac{HEqV_2}{HEqV_1} \right)^{V_{MANAGER} / (\Delta HEqV \cdot \Delta t')} -1 = 2.455x^{\$ 86.59 / (\$ 80.50 \cdot 3.731)} -1 = + 29.56 \% \]](https://valuebridge.net/wp-content/ql-cache/quicklatex.com-3b265a8bad090ea11cbe189f9c299770_l3.png "Rendered by QuickLaTeX.com")
Resources
ValueBridge.net Modules
- 13. Market-driven Multiple Expansion
- 15. Market-driven Revenue Growth
- 19. Market versus Manager-driven Returns
- 21. Foreign Exchange Rates
- 29. Equity Distributions
- 30. Add-on Acquisitions
Additional Resources
See the PME versus Value Creation, Market Valuation Multiples, and Addressable Market and Market Share videos and related content at AUXILIA Mathematica.
Please log in access additional content. Not a subscriber? Sign-up today!.