

Quickly measure the market vs. manager IRR, with a handful of market multiple, addressable market, and FX data points.
The first cross border value bridge case study used the Derivative Model to measure how various market forces drive returns, and then combined them to estimate a Market vs. Manager-driven Return. The Logarithmic Model can usually provide comparable measurements more easily, with much less data.
Consider an institutional Limited Partner based in the US. They invest in a private equity Fund manager based in Europe. The Fund makes a portfolio investment that is based in Spain.
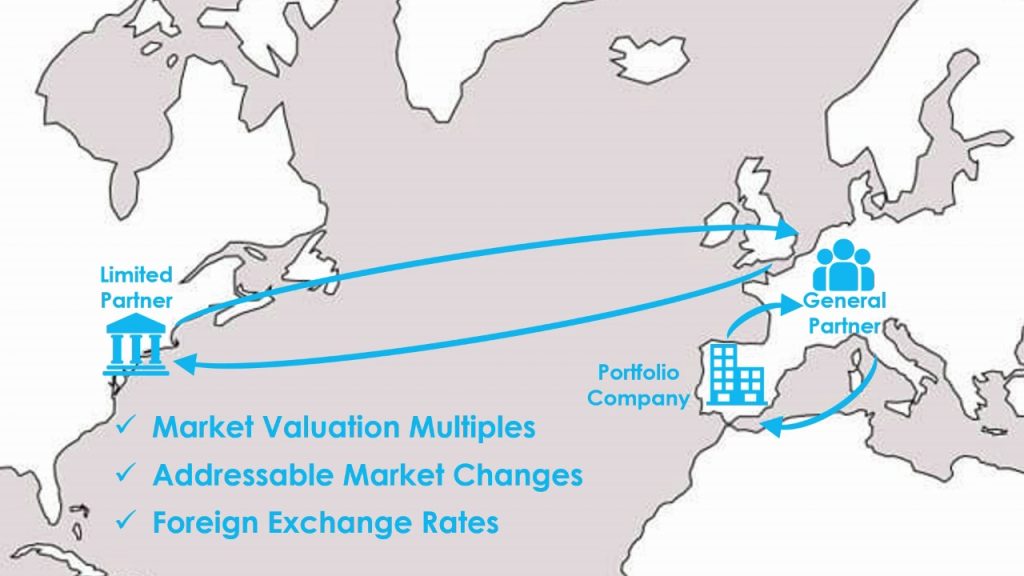
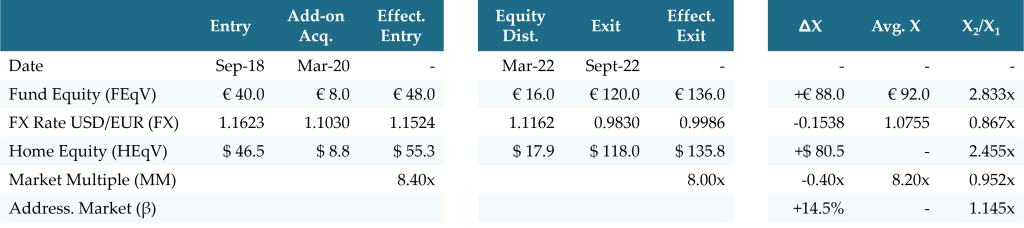
The GP’s Fund Equity Value (FEqV) of EUR can be converted to the LP’s Home Equity Value (HEqV) of USD using foreign exchange rates available on many finance websites, such as Yahoo! Finance. An investment banking publication suggests that prevailing market valuation multiples contracted from 8.40x at entry to 8.00x at exit. Further, economic data suggests that the company’s addressable market increases by 14.5% over the hold.
Using the Logarithmic Model, this is all that is need to calculate a Market vs. Manager-driven Return. While results will be nearly identical to what is calculated by the Derivative Model, this approach requires 70% less data.
Market vs. Manager-driven Multiple of Invested Capital
In the Derivative Model, the fundamental unit of value creation is a currency, where value drivers are combined with addition. In the Logarithmic Model, the fundamental unit of value creation is the equity return multiplier, where value drivers are combined with multiplication. Thus, the market-driven return is the product of applicable market drivers which, in this example, include foreign exchange rates, market multiples, and addressable market changes.
![\[ \chi_{MARKET} = \chi_{FX} \cdot \chi_{MME} \cdot \chi_{AMG} \]](https://valuebridge.net/wp-content/ql-cache/quicklatex.com-72be7a0a9b7b89ff0f3a1134c315109d_l3.png "Rendered by QuickLaTeX.com")
![\[ = \frac{FX_2}{FX_1} \cdot \frac{MM_2}{MM_1} \cdot \left( 1+\beta \right) = \frac{0.9986}{1.1524} \cdot \frac{8.00x}{8.40x} \cdot \left( 1+ 14.5 \% \right) \]](https://valuebridge.net/wp-content/ql-cache/quicklatex.com-18d0b099c2a9a0c087473a7bb3cd45e5_l3.png "Rendered by QuickLaTeX.com")
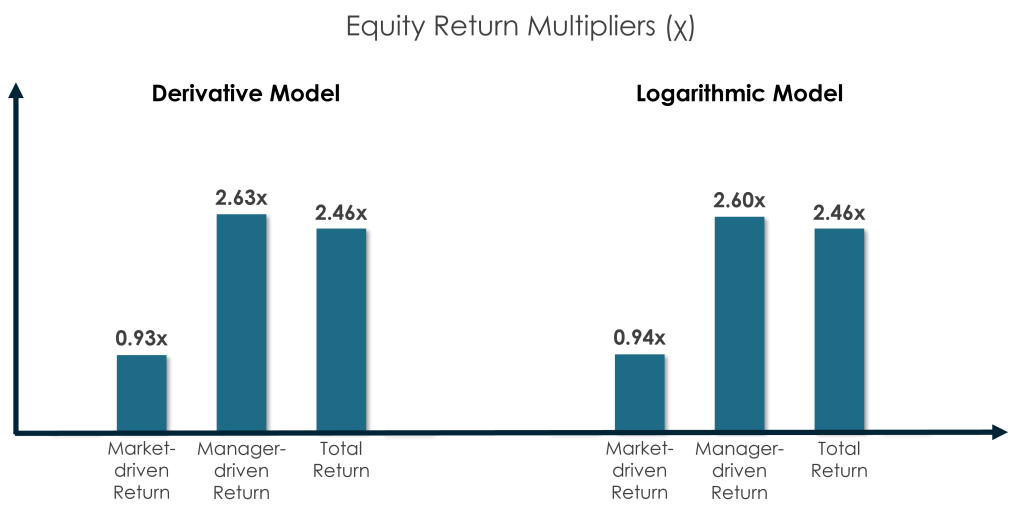
![\[ = 0.867x \cdot 0.952x \cdot 1.145x = 0.945x \]](https://valuebridge.net/wp-content/ql-cache/quicklatex.com-f42768081bc7b016a09b24508973fee8_l3.png "Rendered by QuickLaTeX.com")
In the Logarithmic Model, the total return in the LP’s base currency of USD can be expressed as the product of this Market-driven Return and a Manager-driven Return, where:
![\[ \frac{HEqV_2}{HEqV_1} = \chi_{MARKET} \cdot \chi_{MANAGER} \]](https://valuebridge.net/wp-content/ql-cache/quicklatex.com-e27be950581843dfa22d56ac89cf0c03_l3.png "Rendered by QuickLaTeX.com")
Rearranging this formula provides a Manager-driven return multiple that is fully adjusted for broader-market forces, where:
![\[ \chi_{MANAGER} = \frac{HEqV_2 / HEqV_1}{\chi_{MARKET}} = \frac{HEqV_2 / HEqV_1}{\chi_{FX} \cdot \chi_{MME} \cdot \chi_{AMG}} \]](https://valuebridge.net/wp-content/ql-cache/quicklatex.com-202b0c26bd94af2edd50948078bc24a6_l3.png "Rendered by QuickLaTeX.com")
![\[ = \frac{2.455x}{0.867x \cdot 0.952x \cdot 1.145x} = \frac{2.455x}{0.945x} = 2.599x \]](https://valuebridge.net/wp-content/ql-cache/quicklatex.com-10720c49c44dd7c5500801c6fb83fe0b_l3.png "Rendered by QuickLaTeX.com")
The Logarithmic Model results in this case study are virtually identical to the Derivative Model results in the prior case study.
Module 07 demonstrates how these equity return multipliers can be converted back and forth among the various measurements of value creation.
Market vs. Manager-driven IRR
A Manager-driven IRR measurement is much like a Public Market Equivalence (PME) measurement. It is a time-dependent, relative return measurement that deducts the impact of broader market forces from the GP’s return.
Unlike PME, the Manager-driven IRR does not require time series cash flow data, and it is not distorted by a private equity deal having leverage levels different from companies in an index. Further, the market deductions in a Manager-driven IRR measurement are far more flexible, and can be highly customized, as in the current example.
Value creation IRR measurements require a deal’s effective holding period (Δt’), which is determined from a deal’s Gross MOIC and Gross IRR in the Fund’s base currency (EUR). In this case, the effective hold is 3.731 years, where:
![\[ \Delta t' = \frac{\ln{\left( FEqV_2 / FEqV_1 \right) }}{ \ln{\left( 1 + Gross\,IRR \right) } } = \frac{\ln{\left( 2.833x \right)}}{\ln{\left( 1+32.20 \% \right)}} = 3.731 \, years \]](https://valuebridge.net/wp-content/ql-cache/quicklatex.com-4ac333971efc811f2ff61b9c1f4bf8bd_l3.png "Rendered by QuickLaTeX.com")
Value Creation IRR is equal to the equity return multipliers raised to the power of the reciprocal of this effective hold, minus 1.
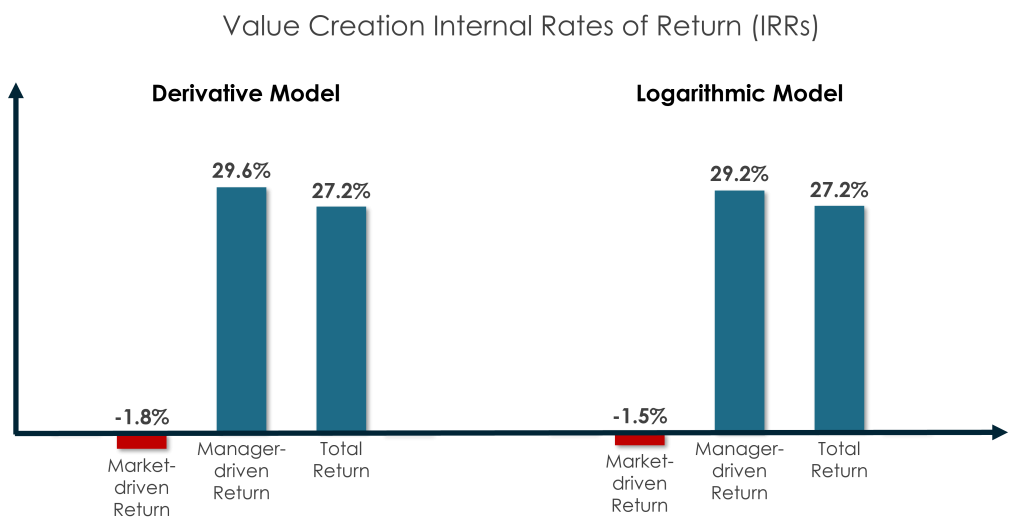
![\[ IRR_{HOME} = \left( \frac{HEqV_2}{HEqV_1} \right)^{1/\Delta t'}-1 = \left( 2.455x \right)^{1/3.731} -1 = +27.2 \% \]](https://valuebridge.net/wp-content/ql-cache/quicklatex.com-8b9e4e891112b244331381f1d9f84e2a_l3.png "Rendered by QuickLaTeX.com")
![\[ IRR_{MARKET} = \left( \chi_{MARKET} \right)^{1/\Delta t'}-1 = \left( 0.945x \right)^{1/3.731} -1 = -1.5 \% \]](https://valuebridge.net/wp-content/ql-cache/quicklatex.com-081f7b13a2082f2cf4132ba79b471651_l3.png "Rendered by QuickLaTeX.com")
![\[ IRR_{MANAGER} = \left( \chi_{MANAGER} \right)^{1/\Delta t'}-1 = \left( 2.599x \right)^{1/3.731} -1 = +29.2 \% \]](https://valuebridge.net/wp-content/ql-cache/quicklatex.com-9a74b89a36a059048f599ae4b3e265d7_l3.png "Rendered by QuickLaTeX.com")
The Logarithmic Model results in this case study are virtually identical to the Derivative Model results in the prior case study.
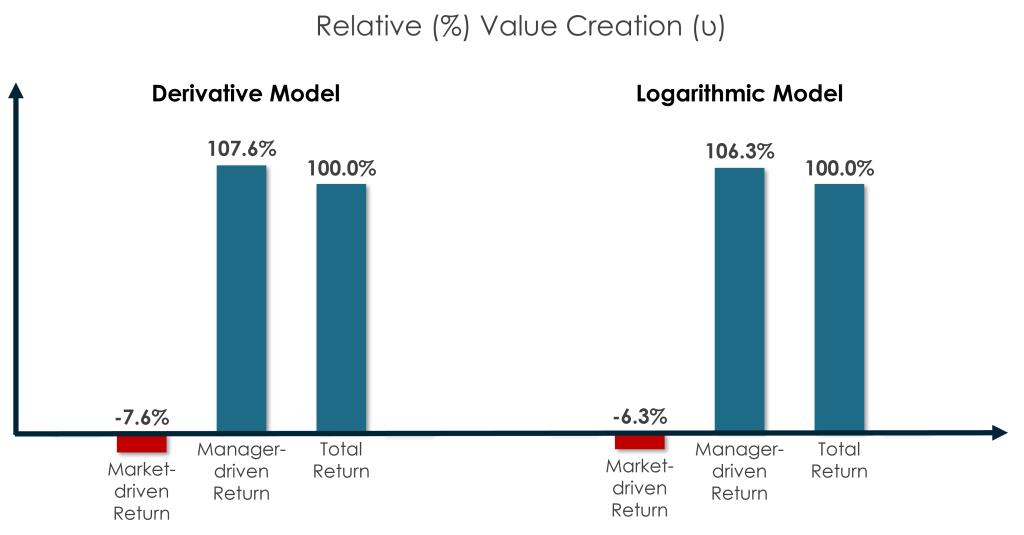
Relative (%) Market vs. Manager-driven Value Creation
Relative (%) value creation represents each value driver’s relative share of total value creation in the LP’s home currency of USD. It is equal to the natural logarithm of the equity return multiplier, divided by the natural logarithm of the multiple of invested capital in the home currency.
![\[ \upsilon_{HOME} = \frac{\ln{\left( HEqV_2 / HEqV_1 \right)}}{\ln{\left( HEqV_2 / HEqV_1 \right)}} = \frac{\ln{ \left( 2.455x \right) }}{\ln{ \left( 2.455x \right) }} = 100.0 \% \]](https://valuebridge.net/wp-content/ql-cache/quicklatex.com-7057773282477805f18f341008a7c9bf_l3.png "Rendered by QuickLaTeX.com")
![\[ \upsilon_{MARKET} = \frac{\ln{\left( \chi_{MARKET} \right)}}{\ln{\left( HEqV_2 / HEqV_1 \right)}} = \frac{\ln{ \left( 0.945x \right) }}{\ln{ \left( 2.455x \right) }} = -6.3 \% \]](https://valuebridge.net/wp-content/ql-cache/quicklatex.com-97b6b8ef63a4c26094f3a0f0e962c6a3_l3.png "Rendered by QuickLaTeX.com")
![\[ \upsilon_{MANAGER} = \frac{\ln{\left( \chi_{MANAGER} \right)}}{\ln{\left( HEqV_2 / HEqV_1 \right)}} = \frac{\ln{\left( 2.599x \right)}}{\ln{ \left( 2.455x \right) }} = +106.3 \% \]](https://valuebridge.net/wp-content/ql-cache/quicklatex.com-6ec732353beabd93fda8104cdc3dfc11_l3.png "Rendered by QuickLaTeX.com")
The Logarithmic Model results in this case study are virtually identical to the Derivative Model results in the prior case study.
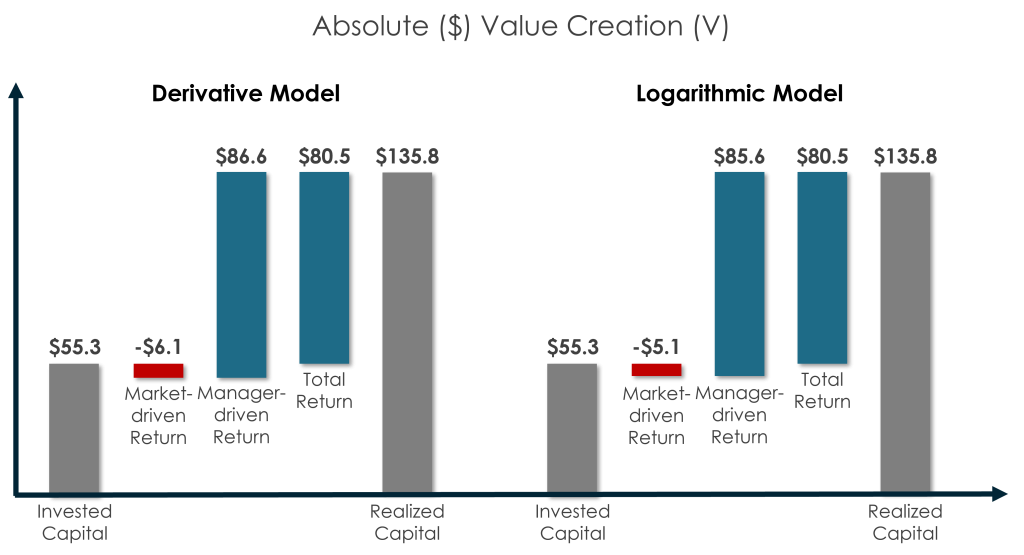
Absolute ($) Market vs. Manager-driven Value Creation
Absolute ($) value creation represents each value driver’s total value creation in the LP’s home currency of USD. It is equal to the product of the total change of capital in the home currency and relative (%) value creation.
![\[ V_{HOME} = \Delta HEqV \cdot \upsilon_{HOME} = \$80.5 \cdot 100.0 \% = +\$ 80.5 \]](https://valuebridge.net/wp-content/ql-cache/quicklatex.com-c373681e3966fe255fd50a0defdf437c_l3.png "Rendered by QuickLaTeX.com")
![\[ V_{MARKET} = \Delta HEqV \cdot \upsilon_{MARKET} = \$80.5 \cdot \left(-6.3 \% \right) = -\$ 5.1 \]](https://valuebridge.net/wp-content/ql-cache/quicklatex.com-dfc5d96a7485b95e55b0ece7dad1b3dd_l3.png "Rendered by QuickLaTeX.com")
![\[ V_{MANAGER} = \Delta HEqV \cdot \upsilon_{MANAGER} = \$80.5 \cdot 106.3 \% = +\$ 85.6 \]](https://valuebridge.net/wp-content/ql-cache/quicklatex.com-97753a34b1db02e0750cc1cab74e7e47_l3.png "Rendered by QuickLaTeX.com")
The Logarithmic Model results in this case study are virtually identical to the Derivative Model results in the prior case study.
Resources
ValueBridge.net Modules
- 13. Market-driven Multiple Expansion
- 15. Market-driven Revenue Growth
- 19. Market versus Manager-driven Returns
- 21. Foreign Exchange Rates
- 29. Equity Distributions
- 30. Add-on Acquisitions
Additional Resources
See the PME versus Value Creation, Market Valuation Multiples, and Addressable Market and Market Share videos and related content at AUXILIA Mathematica.
Please log in access additional content. Not a subscriber? Sign-up today!.