

Why the conventional private equity value bridge is broken, and what you need to do to fix it.
Private equity value creation models used by GPs and LPs, and even academic and industry researchers, usually fail to capture how debt amplifies equity gains and losses.
Fortunately, a broken value bridge can be fixed quite easily…
A Conventional Value Bridge
Consider a private equity portfolio company that grows enterprise valuation from $100 to $180 million. At entry, it has net debt of $50 million, which it pays down to $25 million at exit. This means that total shareholder equity grows from $50 to $155 million, and the investment creates $105 million of equity value and has a 3.10x equity return.
Over the holding period, the company’s TTM EBITDA grows from $20 to $30 million, so its valuation multiple expands from 5.00x at entry to 6.00x at exit.
| Entry | Exit | ΔX | Avg. X | ||||
|---|---|---|---|---|---|---|---|
| Total Equity (TEqV) | $50.0 | $155.0 | +$105.0 | $102.5 | |||
| Net Debt (ND) | $50.0 | $25.0 | -$25.0 | – | |||
| Enterprise Value (TEV) | $100.0 | $180.0 | +$80.0 | $140.0 | |||
| Equity Ratio (ER) | 50.0% | 86.1% | +36.1% | 68.1% | |||
| Debt Ratio (DR) | 50.0% | 13.9% | -36.1% | 31.9% | |||
| EBITDA (E) | $20.0 | $30.0 | +$10.0 | $25.0 | |||
| Valuation Multiple (M) | 5.00x | 6.00x | +1.00x | 5.50x |
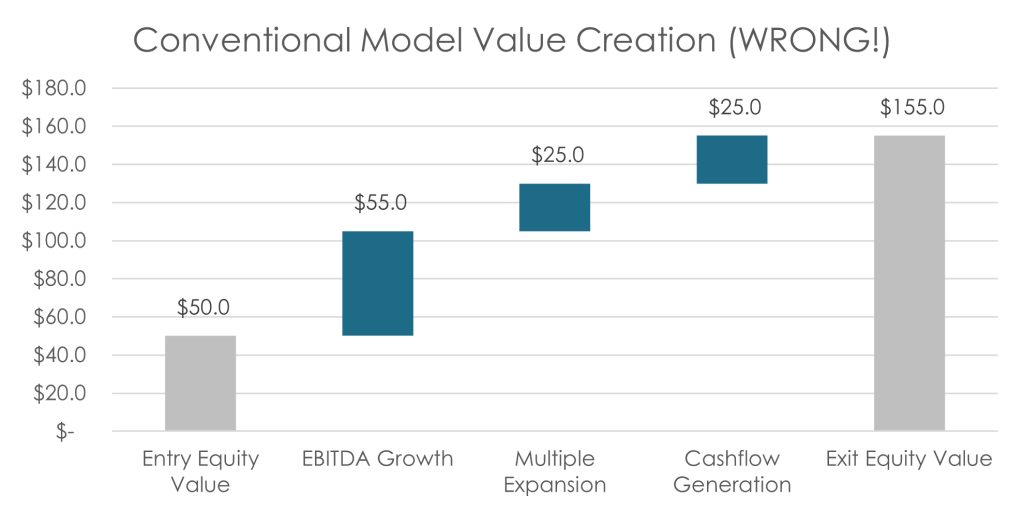
The Conventional value bridge would attribute the total shareholder equity value change to EBITDA Growth (VEG), Multiple Expansion (VME), and Cashflow Generation (VCF), where:
![\[ V_{EG} = \Delta E \cdot \overline{M} = +\$10.0 \cdot 5.5x = + \$ 55.0 \]](https://valuebridge.net/wp-content/ql-cache/quicklatex.com-864d4fec2cb278a40cf8012a780c7886_l3.png "Rendered by QuickLaTeX.com")
![\[ V_{ME} = \Delta M \cdot \overline{E} \cdot \overline{ER} = +1.0x \cdot \$ 25 = + \$ 25.0 \]](https://valuebridge.net/wp-content/ql-cache/quicklatex.com-31c90e9a3870d60343e355dd4f6abbc2_l3.png "Rendered by QuickLaTeX.com")
![\[ V_{CF} = -\Delta ND = - \left( - \$25.0 \right) = + \$ 25.0 \]](https://valuebridge.net/wp-content/ql-cache/quicklatex.com-36fb13c80d5c975a372f8bfcc331c905_l3.png "Rendered by QuickLaTeX.com")
These three value drivers sum to the total equity gain of +$105 million, and bridge the gap between the entry equity value of $50 million and exit equity value of $155 million.
Where’s the Leverage?
Sometimes analysts describe the third value driver as “gearing” or “leverage”, but this just represents changes in debt or cash. VCF does not measure debt’s amplification of equity gains and losses.
Positive VCF, as above, represents debt that was paid down or cash that accumulated on the portfolio company’s balance sheet. It is capital that could have been distributed to shareholders during the hold. It is effectively an equity dividend that gets paid to shareholders on the last day of a holding period.
Negative VCF would represent additional capital that was consumed to maintain the company’s enterprise valuation. That is effectively a follow-on equity investment that gets deducted from the exit proceeds.
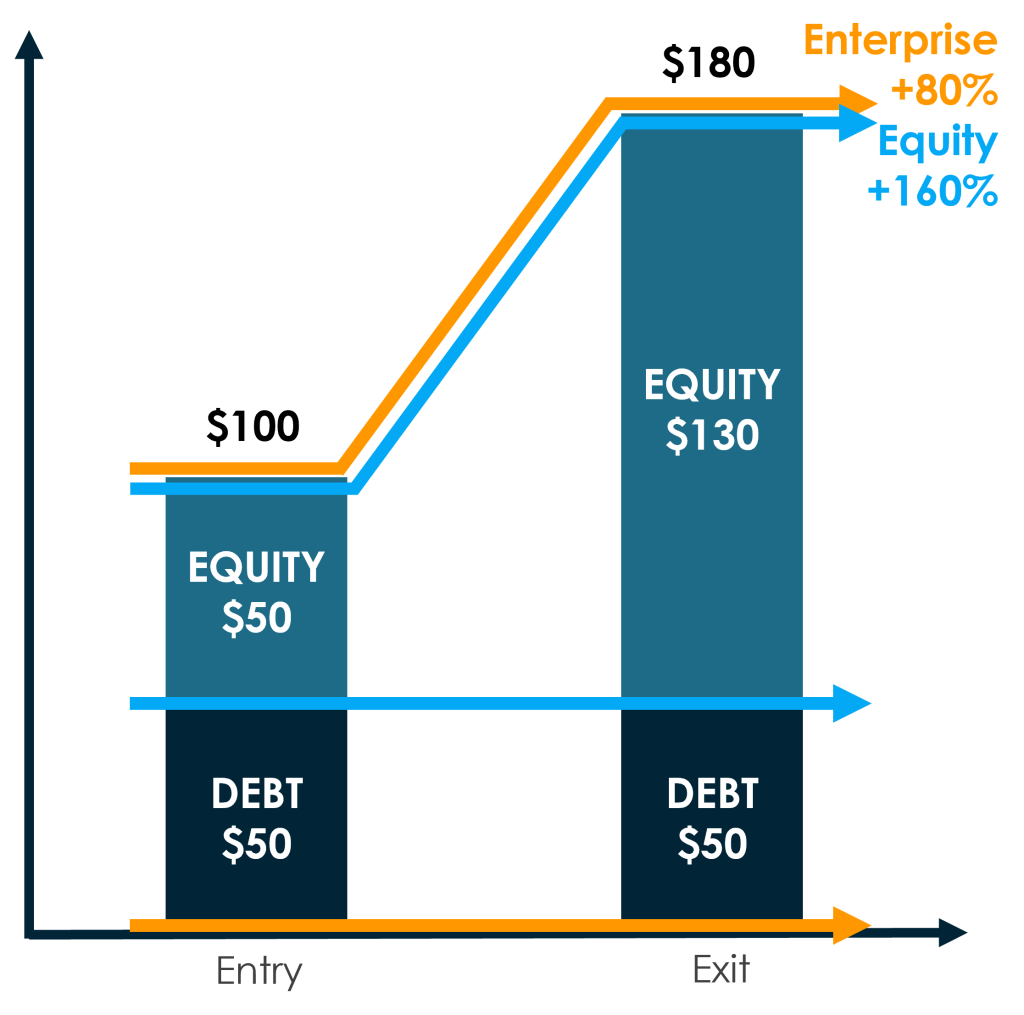
To conceptualize debt’s amplification of equity gains and losses, start with the capital structure above, and then grow the company to $180 million, while holding net debt constant. On an absolute ($) basis, the enterprise and equity valuation both increase by $80 million. However, on a relative (%) basis, the enterprise valuation only increases by 80%, while the equity valuation increases by 160%. A real leverage measurement must account for this difference in relative valuation growth (equity versus enterprise).
Fixing a Broken Value Bridge
Only two changes are needed to fix the Conventional value bridge. First, unlever the EBITDA Growth and Multiple Expansion value drivers by multiplying by λ. For an LBO, λ will always be a positive value that is less than 100%. Next, fill the gap caused by λ with Gearing (VGEAR), which is the change in the company’s enterprise valuation times (1 – λ).
![\[ V_{EG} = \Delta E \cdot \overline{M} \cdot \lambda \]](https://valuebridge.net/wp-content/ql-cache/quicklatex.com-63e183cbd5407c84c40493d0f86deb4e_l3.png "Rendered by QuickLaTeX.com")
![\[ V_{ME} = \Delta M \cdot \overline{E} \cdot \lambda \]](https://valuebridge.net/wp-content/ql-cache/quicklatex.com-5f75814e349718cf4b8e364a7c7969a5_l3.png "Rendered by QuickLaTeX.com")
![\[ V_{GEAR} = \Delta TEV \cdot \left( 1 - \lambda \right) \]](https://valuebridge.net/wp-content/ql-cache/quicklatex.com-2fe81e72a95551177758f66dad722e29_l3.png "Rendered by QuickLaTeX.com")
![\[ V_{CF} = -\Delta ND \]](https://valuebridge.net/wp-content/ql-cache/quicklatex.com-b00f1c49455345d19a426ab6996a9714_l3.png "Rendered by QuickLaTeX.com")
Academic Leverage Model
In the academic and industry literature, λ is often calculated using a weighted-average cost of capital (WACC) framework that includes a deal’s total equity IRR (IRREQUITY), average holding period debt-to-equity ration (D/E), weighted-average cost of debt or interest rate (rD), and corporate tax rate (T), where:
![\[ \lambda = 1-\frac{1+\frac{r_D \cdot \left( 1 - T\right) \cdot \overline{D/E}}{IRR_{EQUITY}}}{1+\overline{D/E}} \]](https://valuebridge.net/wp-content/ql-cache/quicklatex.com-6de173941f17f3954b9dfb70ab1227ad_l3.png "Rendered by QuickLaTeX.com")
There are several problems with this approach. The equation is complicated and requires data that may be inaccessible. Further, in the book and elsewhere, a sensitivity analysis shows that, under the stress of high leverage or large changes in debt, the WACC-driven λ becomes volatile and produces spurious results.
There are easier λs that provide more reliable value creation measurements.
A Better Value Bridge
The average holding period equity ratio (68.1% in the table above) is a convenient and highly effective λ.
![\[ \lambda = \overline{ER} \]](https://valuebridge.net/wp-content/ql-cache/quicklatex.com-d8d0b3334a08ddb2563da2fe57286d28_l3.png "Rendered by QuickLaTeX.com")
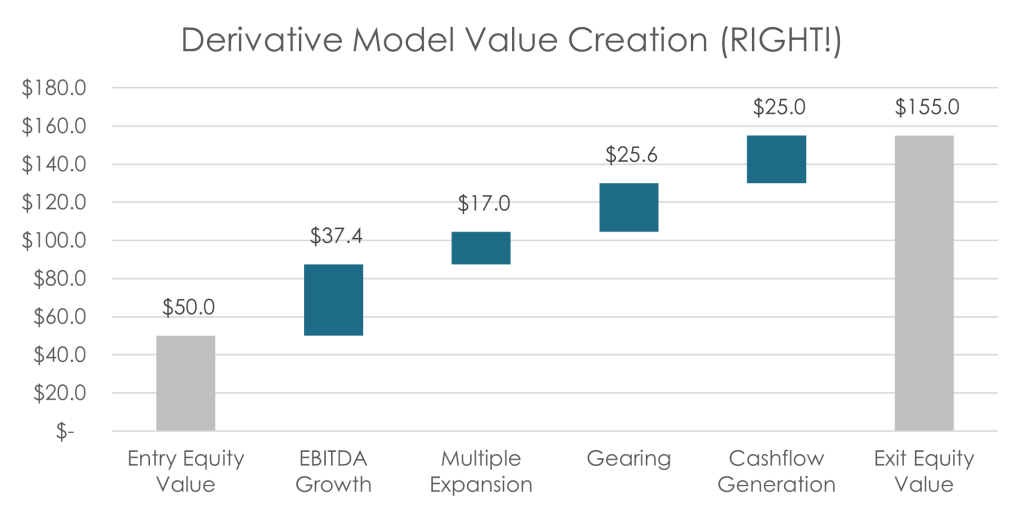
Further, since ER and DR must sum to 100%, the (1 – λ) term can be replaced with the average holding period debt ratio, or 31.9%. This provides the following equations and value creation measurements:
![\[ V_{EG} = \Delta E \cdot \overline{M} \cdot \overline{ER} = +\$10.0 \cdot 5.5x \cdot 68.1 \% = + \$ 37.4 \]](https://valuebridge.net/wp-content/ql-cache/quicklatex.com-716241b153c3dbdf3d9915092baf896e_l3.png "Rendered by QuickLaTeX.com")
![\[ V_{ME} = \Delta M \cdot \overline{E} \cdot \overline{ER} = +1.0x \cdot \$ 25 \cdot 68.1 \% = + \$ 17.0 \]](https://valuebridge.net/wp-content/ql-cache/quicklatex.com-973ad336ccec04d676751e7737398c7d_l3.png "Rendered by QuickLaTeX.com")
![\[ V_{GEAR} = \Delta TEV \cdot \overline{DR} = + \$ 80.0 \cdot 31.9 \% = + \$ 25.6 \]](https://valuebridge.net/wp-content/ql-cache/quicklatex.com-75def94289c309cf564d5c6e54294669_l3.png "Rendered by QuickLaTeX.com")
These four value drivers sum to the total equity gain of +$105 million, and bridge the gap between the entry equity value of $50 million and exit equity value of $155 million.
Gearing, Cashflow Generation, and the Leverage Effect
ValueBridge.net reserves the term “Gearing” for just this amplification (or dampening) of equity gains (or losses). The “Leverage Effect” (VLEV) is defined to include both Gearing and Cashflow Generation. VLEV is driven by changes in a company’s equity ratio, and it is related to VGEAR and VCF as follows:
![\[ V_{LEV} = V_{GEAR} + V_{CF} \]](https://valuebridge.net/wp-content/ql-cache/quicklatex.com-ff0a3758b84d9408afe6ee648152cf9a_l3.png "Rendered by QuickLaTeX.com")
![\[ \Delta ER \cdot \overline{TEV} = \Delta TEV \cdot \overline{DR} - \Delta ND \]](https://valuebridge.net/wp-content/ql-cache/quicklatex.com-8cb336e477f2d2892dff0827402825d5_l3.png "Rendered by QuickLaTeX.com")
![\[ + 36.1 \% \cdot \$ 140 = + \$80 \cdot 31.9 \% - \left( - \$25 \right) \]](https://valuebridge.net/wp-content/ql-cache/quicklatex.com-98cd7d412cb7873a8ef3e23b3461f6c1_l3.png "Rendered by QuickLaTeX.com")
![\[ \$ 50.6 = \$ 25.6 + \$25.0 \]](https://valuebridge.net/wp-content/ql-cache/quicklatex.com-486cde2be29a27b108bc4bfce3ee736d_l3.png "Rendered by QuickLaTeX.com")
Back-of-the-Envelope Value Creation Calculations
What if you must fix a Conventional value bridge, but don’t have the capital structure and P&L data necessary to re-run the analysis? That’s no problem if you can estimate typical capital structure ratios for the GP’s portfolio. Simply unlever the P&L and valuation components with the average holding period equity ratio and let Gearing make up the difference.
Example: If a buyout GP typically starts with debt ratio around 50% and, through debt paydown and enterprise valuation growth, reduces it to around 30% at exit, then expect an average debt ratio of 40% and equity ratio of 60% over the hold. Simply multiply VEG and VME values by 60%, and let VGEAR=40%*(VEG+VME). VCF does not change.
ValueBridge.net Resources
Module 03. Unlevered Return and the Leverage Effect
Module 08. Gearing and Cashflow in an LBO
Module 09. Gearing and Cashflow in a Growth Investment
Other Resources
Private Equity Value Creation Analysis: Volume I: Theory
Reinard, M. 2021. Private Equity Value Creation Analysis: Volume I: Theory: A Technical Handbook for the Analysis of Private Companies and Portfolios. AUXILIA Press.
See Chapter 5: Levered and Unlevered Returns.
Available at Amazon.com.
AUXILIA Mathematica Video Series
- VC102: Conventional Model of Value Creation (YouTube | Episode Page)
- VC103: Munich Model of Value Creation (YouTube | Episode Page)
- VC104: Derivative Model of Value Creation (YouTube | Episode Page)
- VC107: Leverage in Private Equity I (YouTube | Episode Page)
- VC114: Excess Leverage in Private Equity (YouTube | Episode Page)
AUXILIA Mathematica Articles
- Leverage in the Private Equity Value Bridge
- Alternative Leverage Models
- A Better Leverage Model
- Measuring Market or Sector Leverage
- Leverage Proofs and References
- Logarithmic Model Leverage, Gearing, and Cashflow Generation
- Leverage in the Munich Model
Academic and Industry Studies
Acharya, V., and O. Gottschalg, M. Hahn, C. Kehoe. 2013. Corporate Governance and Value Creation: Evidence from Private Equity. Review of Financial Studies, 26 (2), pp.368–402.
http://pages.stern.nyu.edu/~sternfin/vacharya/public_html/20120219_final.pdf
Achleitner, A. and Braun, R., Engel, N., Figge, C., Tappeiner, F., 2010. Value Creation Drivers in Private Equity Buyouts: Empirical Evidence from Europe, The Journal of Private Equity, Vol. 13, No. 2 (Spring 2010), pp. 17-27. https://www.jstor.org/stable/43503632
Morris, P. 2016. Evaluating Private Equity’s Performance. KPMG International 133315-G, June 2016.
https://assets.kpmg/content/dam/kpmg/pdf/2016/06/evaluating-private-equitys-performance.pdf
Puche, B. and Achleitner, A., Braun, R. 2016. International Evidence on Value Creation in Private Equity Transactions. The Journal of Applied Corporate Finance, Vol. 27, No. 4 (Fall 2015), pp. 106-122. https://doi.org/10.1111/jacf.12152
Roberts, I. 2015. Value Creation and the Business Cycle. Pantheon, October 2015.
https://www.pantheon.com/wp-content/uploads/2015/10/InFocus-Value-Creation-and-the-Business-Cycle.pdf
Please log in access additional content. Not a subscriber? Sign-up today!.