

Measure the equity return impact of fixed-cost ESG initiatives and their influence on portfolio company valuation.
The site’s value creation models explain how private equity returns are driven by changes in portfolio company P&Ls, capital structures, and market conditions. The same mathematics can be used to methodically examine the equity value impact of certain Environmental, Social, and Governance (ESG) initiatives.
Quantifying ESG Factors
Analysts can easily quantify ESG initiatives that have predictable and measurable influence on portfolio company income statements, balance sheets, and valuations. This case study illustrates two examples:
Operating Expense Margin (SG&A) Impact
ESG initiatives may increase the fixed cost of delivering products or services to customers. Staff must be hired (or redirected) to implement and monitor ESG programs. Facilities that are more ecologically-friendly will cost more. By increasing SG&A, such initiatives will generally reduce a company’s equity valuation and reduce investor ROI.
Valuation Impact
Significant interest in ESG among GPs and LPs can make some companies more valuable in an M&A process. All else being equal, the EBITDA and revenue streams of a more ESG-aligned company should be worth more. This will generally increase a company’s equity valuation and increase investor ROI.
ESG Initiative Impact on Capital Structure and P&L
Consider a $100.0 company that is capitalized with $50.0 of total equity and $50.0 of net debt. It has $80.0 of revenue, $32.0 of COGS, and $28.0 of SG&A, providing $20.0 of EBITDA. Prior to the ESG investment, the company has an EBITDA margin (E/R) of 25.0% and an operating expense margin (SG&A/R) of 35.0%. The company’s $100.0 enterprise valuation is 5.00x its EBITDA.
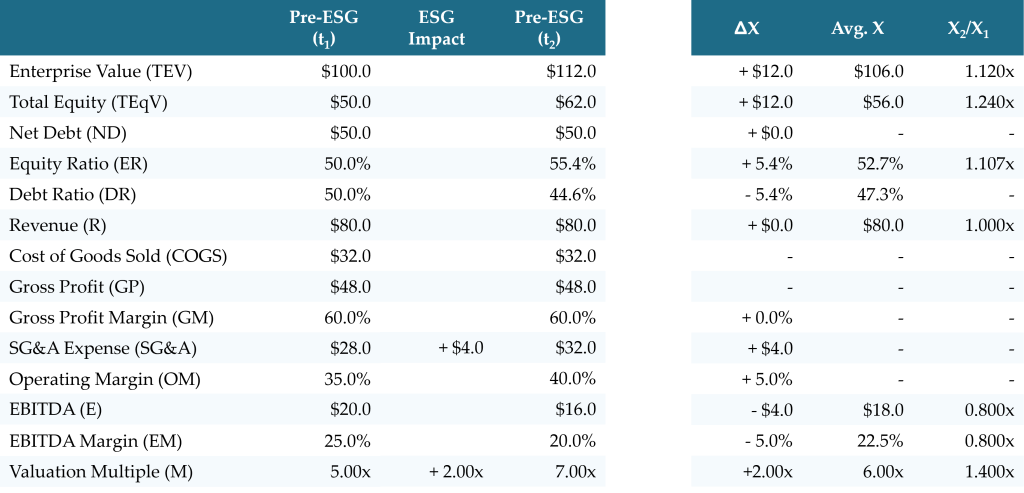
Assume that certain ESG initiatives add $4.0 of annual fixed costs to the company’s SG&A. This would decrease EBITDA to $16.0, decrease the EBITDA margin to 20%, and increase the operating expense margin to 40.0%. However, the company’s cleaner and greener positioning now increases its valuation multiple from 5.00x to 7.00x.
The post-ESG enterprise valuation is 7.00x its EBITDA of $16.0, or $112.0. Net debt remains unchanged, so this raises the value of total shareholder equity to $62.0. Thus, the ESG initiatives provide an equity gain of $12.0, or 24.0%.
The causes of equity value creation can be quantified by comparing the pre-ESG (t1) and post-ESG (t2) metric absolute changes, averages, and equity return multipliers, as above.
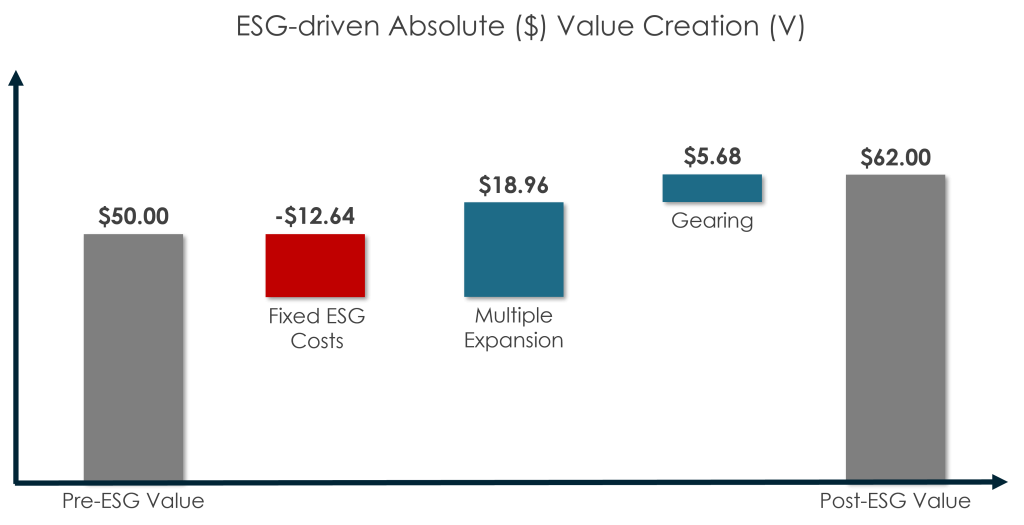
ESG-driven Absolute ($) Value Creation
The Derivative Model provides the quickest path to measuring absolute ($) value creation. Only three value drivers, including Multiple Expansion (VME), Operating Margin Reduction (VOMR), and Gearing (VGEAR), are material in this example. Other value drivers, like Revenue Growth (VME), Gross Margin Expansion (VGME), and Cashflow Generation (VCF) are $0.0 because there is no change in revenue, gross margin, or net debt.
Multiple Expansion (see Module 04), driven by the manager creating a more ESG-aligned company, is equal to the product of the 2.00x increase in valuation and the average holding period EBITDA and equity ratio:
![\[ V_{ME} = \Delta M \cdot \overline{E} \cdot \overline{ER} = + 2.00x \cdot \$18.0 \cdot 52.7 \% = + \$ 18.96 \]](https://valuebridge.net/wp-content/ql-cache/quicklatex.com-305fa7670673c92e318dd348e58cfe7a_l3.png "Rendered by QuickLaTeX.com")
Operating Margin Reduction (see Module 12), driven by fixed ESG costs of $4.0 added to company SG&A, is equal to the product of minus the change in the operating expense margin (+5.0%) and the average holding period revenue, valuation multiple, equity ratio:
![\[ V_{OMR} = -\Delta OM \cdot \overline{M} \cdot \overline{ER} = - \left( + 5.0 \% \right) \cdot \$80.0 \cdot 6.00x \cdot 52.7 \% = - \$12.64 \]](https://valuebridge.net/wp-content/ql-cache/quicklatex.com-24ca769373c53bc99e27ddcb8a2f0d94_l3.png "Rendered by QuickLaTeX.com")
The remaining value creation is explained by Gearing (see Module 08), which represents debt’s amplification of the equity gains and losses, which are caused by Multiple Expansion and Operating Margin Reduction, above. Gearing is the product of the change in enterprise valuation and average holding period debt ratio:
![\[ V_{GEAR} = \Delta TEV \cdot \overline{DR} = + \$12.0 \cdot 47.3 \% = +\$5.68 \]](https://valuebridge.net/wp-content/ql-cache/quicklatex.com-41e45c4d55f1e06576a5f7cdaf5aacaa_l3.png "Rendered by QuickLaTeX.com")
These three value drivers sum to the total equity value change of $12.0, and completely bridge the gap between the pre-ESG equity valuation of $50.0 and the post-ESG equity valuation of $62.0.
![\[ \Delta TEqV = V_{RG} + V_{GME} + V_{OMR} + V_{ME} + V_{GEAR} + V_{CF} \]](https://valuebridge.net/wp-content/ql-cache/quicklatex.com-8e30dec1b52c0150e83ec8563a3e9699_l3.png "Rendered by QuickLaTeX.com")
![\[ = \$ 0.0 +\$ 0.0 +\$ 18.96 -\$ 12.64 +\$ 5.68 +\$ 0.0 = +\$ 12.0 \]](https://valuebridge.net/wp-content/ql-cache/quicklatex.com-8a9b80c1736e0e0e4fd90b56b945411b_l3.png "Rendered by QuickLaTeX.com")
Identifying the Break-even Point
What amount of Multiple Expansion would be required to make up for a certain increase in fixed costs, whether that be from ESG or other initiatives?
This question is best answered with the Logarithmic Model, where a deal’s Gross Multiple of Invested Capital (MOIC) is expressed as a function of pre-ESG (t1) and post-ESG (t2) revenues (R), EBITDA margins (EM), valuation multiples (M), equity ratios (ER), and Fund or GP ownership percentages (φ), where:
![\[ MOIC = \frac{R_2}{R_1} \cdot \frac{EM_2}{EM_1} \cdot \frac{M_2}{M_1} \cdot \frac{ER_2}{ER_1} \cdot \frac{\phi_2}{\phi_1} \]](https://valuebridge.net/wp-content/ql-cache/quicklatex.com-3e204d4282aa278632c4d1fe2dd11afd_l3.png "Rendered by QuickLaTeX.com")
For a break-even analysis, the analyst seeks the combinations of variables that cause the MOIC to equal 1.0. Several variables are 1.0 because of constraints built into the example. Both R2/R1 and φ2/φ1 go to 1.0 because no changes are made to the company’s revenue or the GP’s ownership percentage. Further, the only reason that the company’s equity ratio would change is because it is downstream from operating expense margin and valuation changes so, for the purpose of a break-even analysis, that can be set to 1.0 as well. This leaves only the following variables:
![\[ 1.0 = \frac{EM_2}{EM_1} \cdot \frac{M_2}{M_1} \]](https://valuebridge.net/wp-content/ql-cache/quicklatex.com-9ec73dd43324323663a1e139b5da8840_l3.png "Rendered by QuickLaTeX.com")
Solving for the post-ESG valuation multiple (M2):
![\[ M_2 = M_1 \cdot \frac{EM_1}{EM_2} \]](https://valuebridge.net/wp-content/ql-cache/quicklatex.com-add9fa9b31c16ab988227beb6af7aa9b_l3.png "Rendered by QuickLaTeX.com")
After the added cost of ESG initiatives (CostESG), the EBITDA margin (EM2) is equal to EBITDA (E1) minus these costs, all over the company’s revenue (R1), and therefore:
![\[ EM_2 = \frac{E_1 - Cost_{ESG}}{R_1} = EM_1 - \frac{Cost_{ESG}}{R_1} \]](https://valuebridge.net/wp-content/ql-cache/quicklatex.com-4a8481467698ccc985217de467886f6f_l3.png "Rendered by QuickLaTeX.com")
Thus, the valuation multiple required to compensate for a certain increase in fixed costs can be expressed:
![\[ M_2 = M_1 \cdot \frac{EM_1}{EM_1 - \frac{Cost_{ESG}}{R_1}} \]](https://valuebridge.net/wp-content/ql-cache/quicklatex.com-8d38f5b27ae95031f84dc8c712e31984_l3.png "Rendered by QuickLaTeX.com")
In the example above, a valuation multiple of 6.25x would be required to compensate for the $4.0 of additional ESG initiative costs, because:
![\[ M_2 = 5.00x \cdot \frac{25.0 \%}{25.0 \% - \frac{\$ 4.0}{\$ 80.0}} = 5.00x \cdot \frac{25.0 \%}{25.0 \% - 5.0 \%} = 6.25 x \]](https://valuebridge.net/wp-content/ql-cache/quicklatex.com-e075e4e24e63650dac998dfaed8e3fad_l3.png "Rendered by QuickLaTeX.com")
Resources
ValueBridge.net Modules:
- 04. EBITDA Growth and Multiple Expansion
- 08. Gearing and Cashflow in an LBO
- 12. Gross Margin Expansion and Operating Margin Reduction
Additional Resources
Also see the ESG in Private Equity video and related content at AUXILIA Mathematica.
Please log in access additional content. Not a subscriber? Sign-up today!.