

Build a cross border return matrix to rapidly evaluate GP-driven returns vs. market forces in private equity portfolios.
This is the third case study on cross border returns, where private equity GP value-add is separated from the broader market impact of foreign exchange rate, valuation, and addressable market changes. A cross border return matrix allows analyst to rapidly estimate these measurements in private equity portfolios.
Consider an institutional Limited Partner based in the US. They invest in a private equity Fund manager based in Europe, who makes a portfolio investments that operate in Spain.
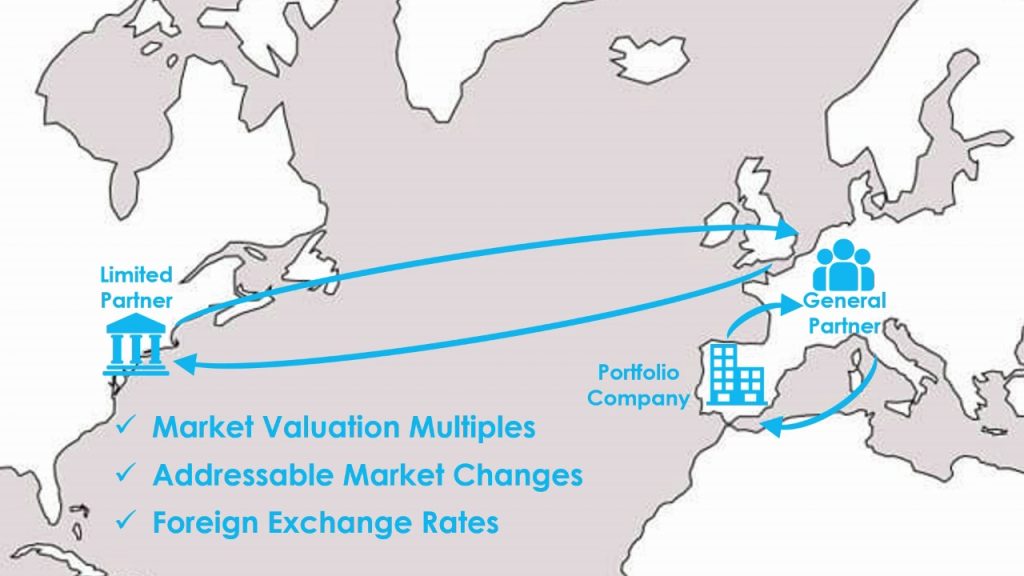
In the Fund’s reporting materials, any return and portfolio company metrics would measured in EUR, but the LP wants to know what those numbers mean in its native currency of USD. They would also like to separate GP value-add from other market drivers, like changes in market valuation multiples and the company’s addressable market.
A Market-driven Return Matrix helps to perform such analyses quickly. The following table describes the Multiple of Invested Capital (MOIC) that is driven by broader market forces, including changes in foreign exchange rates, market valuations, and addressable markets, for various entry dates and exit dates.
Total Market-driven Return Matrix

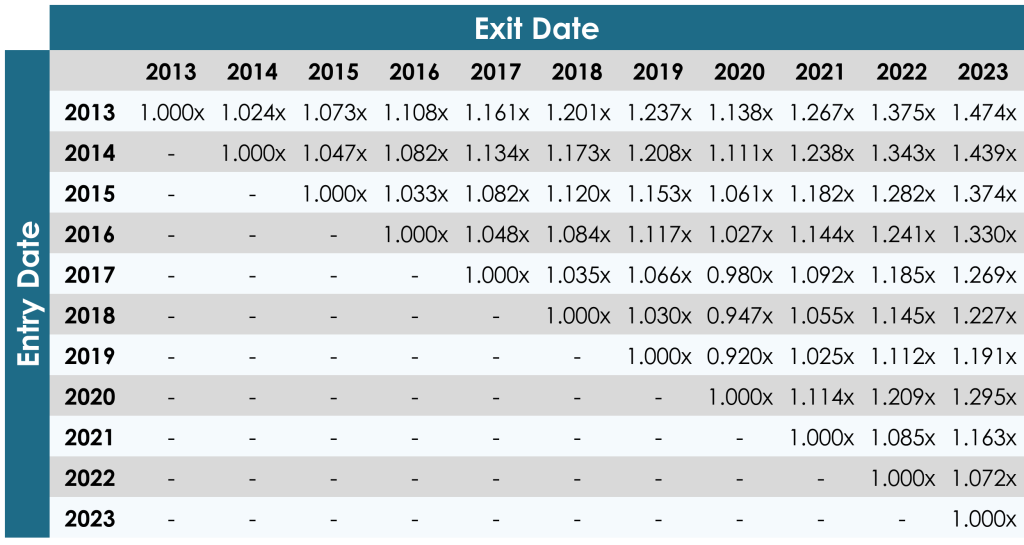
For example, a portfolio company that is acquired in 2016 and exited in 2021 should have a MOIC in the LP’s currency of at least 1.282x. The GP should only get credit for equity value creation over and above this benchmark.
However, a portfolio company acquired in 2018 and exited in 2022 has a Market-driven MOIC on 0.973x. Since the GP is investing against broader market headwinds, their value-add in the deal is greater than what may be found in Fund reporting or marketing materials.
This case study shows how to build a Cross Border Return Matrix, specifically quantify the GP versus market value-add, and then convert those metrics to other value creation measurements, like value creation IRRs.
Source Data for a Cross Border Return Matrix
Foreign Exchange Data
As noted in the first cross border case study, it is almost impossible to precisely trace capital flows between LP and the Fund, and then the the Fund and the portfolio company, even when the Fund and LP use the same currency. They are obscured by too many Fund-level factors, like the use of Fund credit facilities, recycling, management fee offsets, different LPs having different terms and capital call requirements, etc.
Previously, we estimated LP capital flows as if capital is called whenever portfolio investments are made and Fund distributions occur for every portfolio company realization. This time, we simply calculate an average foreign exchange rate for each year. The Foreign Exchange Impact equity return multiplier between any times ti and tj may be expressed:
![\[ \chi_{FX} = \frac{FX_j}{FX_i} \]](https://valuebridge.net/wp-content/ql-cache/quicklatex.com-ee4f725b32236193ebfe4ac667a08b5d_l3.png "Rendered by QuickLaTeX.com")
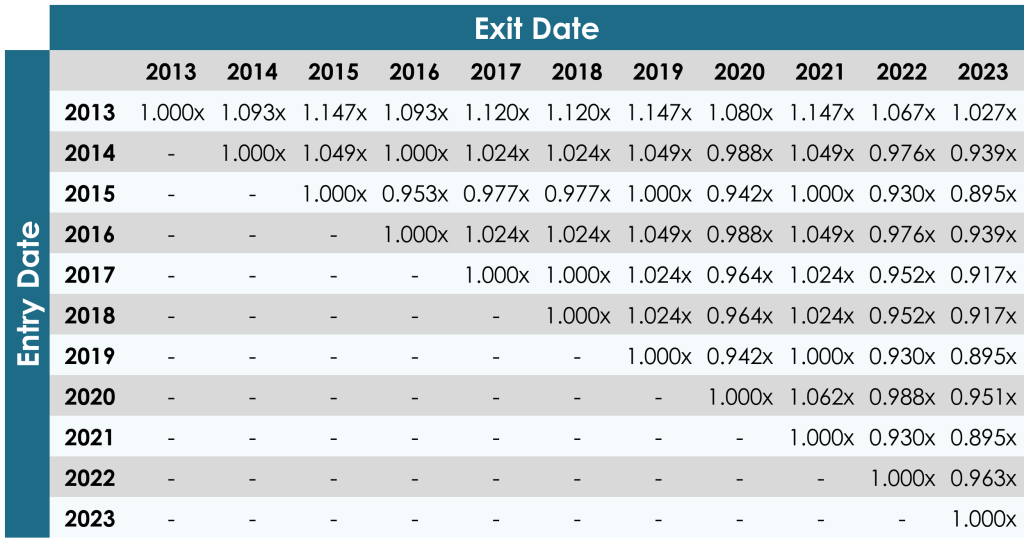
Yahoo! Finance data provides the following return matrix as a proxy for foreign exchange impact:
Foreign Exchange Impact Multipliers

As noted in Module 21, always use the FX rate where the Fund’s currency is the “base” currency. In this case, it is quoted as EURUSD and describes how many USD are required or returned for each EUR (counterintuitively, the units for a EURUSD quote are actually USD/EUR).
Market Valuation Data
Because private equity GPs and LPs talk about market multiple all the time, there are numerous sources that can be filtered by company size, industry, and geography. Many analysts consult services like Pitchbook and GF Data. Investment banks also publish relevant data, like this July 2023 Global M&A Quarterly from R.W. Baird. The Market Multiple Expansion equity return multiplier between any times ti and tj may be expressed:
![\[ \chi_{MME} = \frac{MM_j}{MM_i} \]](https://valuebridge.net/wp-content/ql-cache/quicklatex.com-cbe85e93cd85cc49f3289c4eb52e6b4f_l3.png "Rendered by QuickLaTeX.com")
According to page 13 of the RW Baird report, Europe Middle-Market Enterprise Value to Median EBITDA Multiples would provide the following return matrix for broader market valuations:
Market Valuation Multipliers
You can sign up to receive reports like this by email on the R.W. Baird website: https://www.rwbaird.com/corporations-and-institutions/investment-banking/reports/
Addressable Market Data
Analysts can use macro-economic metrics as a proxy for addressable markets, or finely tune them to the portfolio company’s sector, geography, or niche. This case study simply uses Spain’s GDP as a proxy for the addressable market, so a company that grows faster than the economy will gain market share, and one that grows more slowly than the economy will lose market share. The Addressable Market Growth equity return multiplier between any times ti and tj may be expressed:
![\[ \chi_{AMG} = \frac{AM_j}{AM_i} \]](https://valuebridge.net/wp-content/ql-cache/quicklatex.com-48e5c12de2723d0a27b5e1e4255cdf8c_l3.png "Rendered by QuickLaTeX.com")
Data provided by the St. Louis Federal Reserve provides the following return matrix as a proxy for growth in the company’s addressable market:
Addressable Market Multipliers
Eurostat, Gross Domestic Product for Spain [CPMNACSCAB1GQES], retrieved from FRED, Federal Reserve Bank of St. Louis; https://fred.stlouisfed.org/series/CPMNACSCAB1GQES
Building the Market-driven Return Matrix
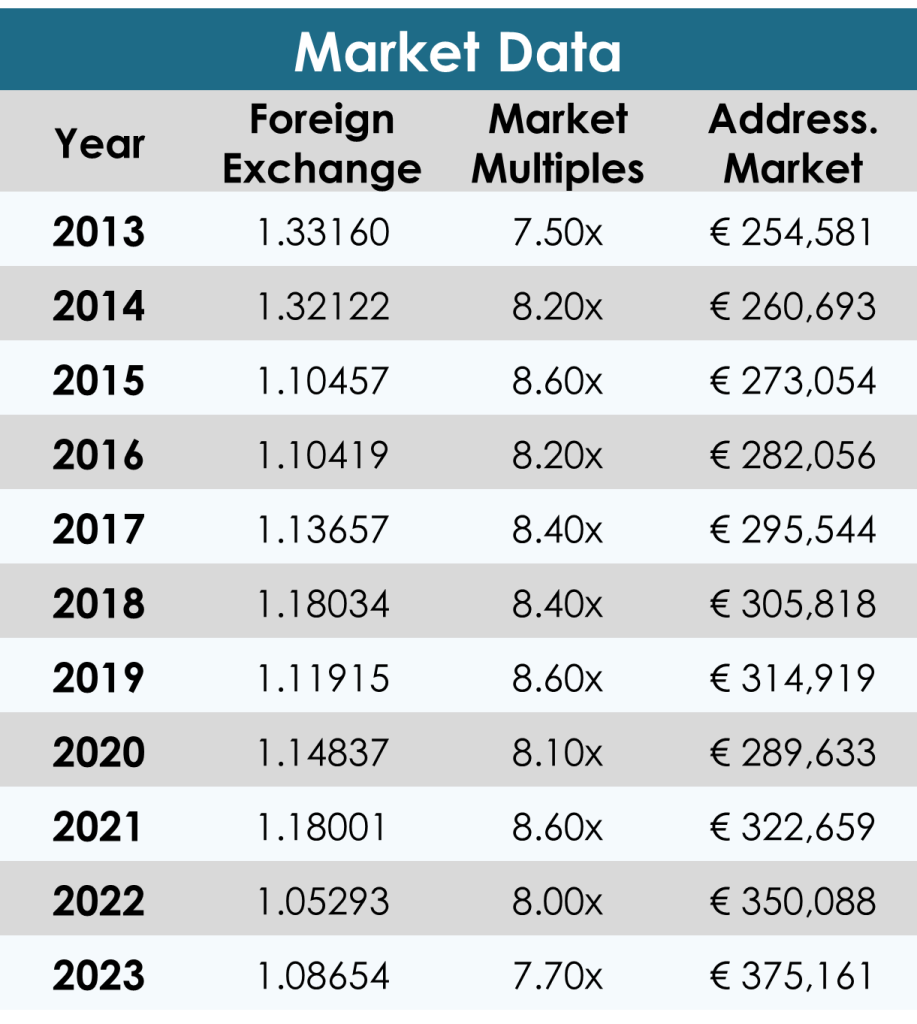
Underlying data from these three market data sources are summarized to the right. The total market-driven MOIC between any times ti and tj may be expressed as:
![\[ \chi_{MARKET(i,j)} = \frac{FX_j \cdot MM_j \cdot AM_j}{FX_i \cdot MM_i \cdot AM_i} \]](https://valuebridge.net/wp-content/ql-cache/quicklatex.com-a8871c85e34e304ff94d5992f58e26c2_l3.png "Rendered by QuickLaTeX.com")
Thus, private equity deals in the space have the following return expectations:
Market-driven Return Matrix
Market vs. Manager-driven Return for a Private Equity Deal
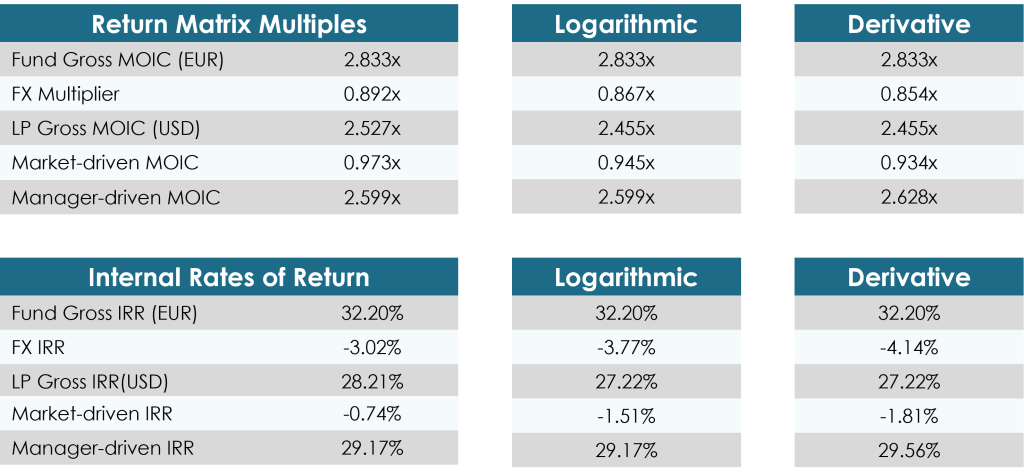
The prior two case studies evaluate a deal that is acquired in 2018 and exited in 2022. In the Fund’s base currency of EUR, it has a Gross MOIC of 2.833x and a Gross IRR of 32.20%. The Foreign Exchange Impact multiplier for this holding period is 0.892x, according to the table above. This strengthening of USD suggests the return in the LP’s home currency (LP Gross MOIC) will lower, where:
![\[ LP\,Gross\,MOIC = Fund\,Gross\,MOIC \cdot \chi_{FX} = 2.833x \cdot 0.982x = 2.527x \]](https://valuebridge.net/wp-content/ql-cache/quicklatex.com-3720342123ef9ded4cea8948cc4aaff1_l3.png "Rendered by QuickLaTeX.com")
The Market-driven MOIC for the holding period is 0.973x, which suggests the Manager-driven MOIC is equal to:
![\[ Manager\,MOIC = \frac{LP\,Gross\,MOIC}{Market\,MOIC} = \frac{2.527x}{0.973x} = 2.599x \]](https://valuebridge.net/wp-content/ql-cache/quicklatex.com-297a638f202eb2b70dbdf0b7b7fa8e9d_l3.png "Rendered by QuickLaTeX.com")
These multiples and multipliers can be converted to IRR measurements with the deal’s effective hold, which is calculated:
![\[ \Delta t' = \frac{ \ln{\left( Fund\,Gross\,MOIC \right)} }{ \ln{\left( 1 + Fund\,Gross\,IRR \right) }} = \frac{2.833x}{1+32.20 \%} = 3.731\,years \]](https://valuebridge.net/wp-content/ql-cache/quicklatex.com-93638c816ca78b1a0153079d7d667b70_l3.png "Rendered by QuickLaTeX.com")
IRRs are equal to the equity return multiples and multipliers raised to the power of the reciprocal of this effective hold, minus 1, where:
![\[ Fund\,Gross\,IRR = \left( Fund\,Gross\,MOIC \right)^{1/\Delta t'} - 1 = \left( 2.833x \right)^{1/3.731}-1 = 32.20 \% \]](https://valuebridge.net/wp-content/ql-cache/quicklatex.com-d91cacf9d3220b1355b21b383d1aa8d8_l3.png "Rendered by QuickLaTeX.com")
![\[ FX\,Impact\,IRR = \left( \chi_{FX} \right)^{1/\Delta t'} - 1 = \left( 0.892x \right)^{1/3.731}-1 = -3.02 \% \]](https://valuebridge.net/wp-content/ql-cache/quicklatex.com-39e491620bff2fef6fb34d2bd66d5150_l3.png "Rendered by QuickLaTeX.com")
![\[ LP\,Gross\,IRR = \left( LP\,Gross\,MOIC \right)^{1/\Delta t'} - 1 = \left( 2.527x \right)^{1/3.731}-1 = 28.21 \% \]](https://valuebridge.net/wp-content/ql-cache/quicklatex.com-7ae30967b60ded332da19aadb7f10e60_l3.png "Rendered by QuickLaTeX.com")
![\[ Market-driven\,IRR = \left( Market\,MOIC \right)^{1/\Delta t'} - 1 = \left( 0.973x \right)^{1/3.731}-1 = -1.51 \% \]](https://valuebridge.net/wp-content/ql-cache/quicklatex.com-eb02fdb4cd4ff33b601396267c239a2a_l3.png "Rendered by QuickLaTeX.com")
![\[ Manager-driven\,IRR = \left( Manager\,MOIC \right)^{1/\Delta t'} - 1 = \left( 2.599x \right)^{1/3.731}-1 = 29.56 \% \]](https://valuebridge.net/wp-content/ql-cache/quicklatex.com-a8674c1235e64fabe7258e4bfc0b2b91_l3.png "Rendered by QuickLaTeX.com")
These results are quite close to those calculted in the prior two case studies, which are more accurate because they make foreign exchange adjustments when inflows and outflows occur, rather than using annual estimates, as above. It is notable that the Logarithmic Model results, from the Quick Cross Border Value Bridge case study, require about twice as many data points, and the Derivative Model results, from the first Cross Border Value Bridge case study, requires about 10 times the data.
Comparison of Return Matrix, Logarithmic Model, and Derivative Model Results
Market vs. Manager-driven Return for a Private Equity Portfolio
The mathematics above can be easily applied to portfolios of multiple deals, like the following:
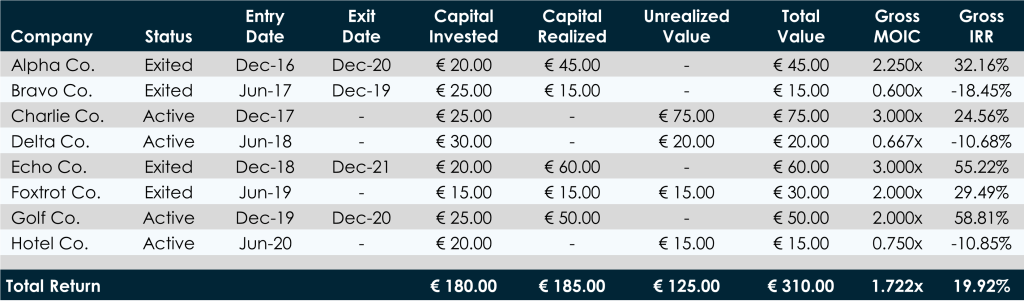
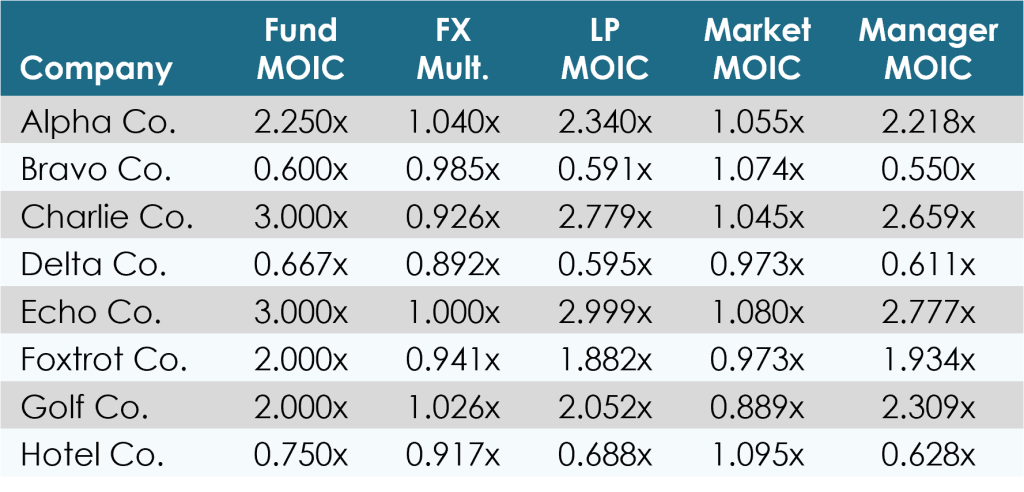
Start with each deal’s Gross MOIC in the Fund’s currency of EUR, and then use the Entry Date and Exit Date to find the appropriate Foreign Exchange Impact Multiplier on the table above. Their product is the Gross MOIC in the LP’s currency of USD. Then use the Entry Date and Exit Date to find the appropriate Market MOIC from the Market-driven Return Matrix. The Manager-driven MOIC is the LP MOIC divided by the Market MOIC.
Each deal has a unique effective hold, driven by the Gross MOIC and Gross IRR in the Fund’s currency of EUR on the table above. Raising any of the multiples to the power of the reciprocal of this effective hold, minus 1, provides an annualized, relative return measurement, as follows:
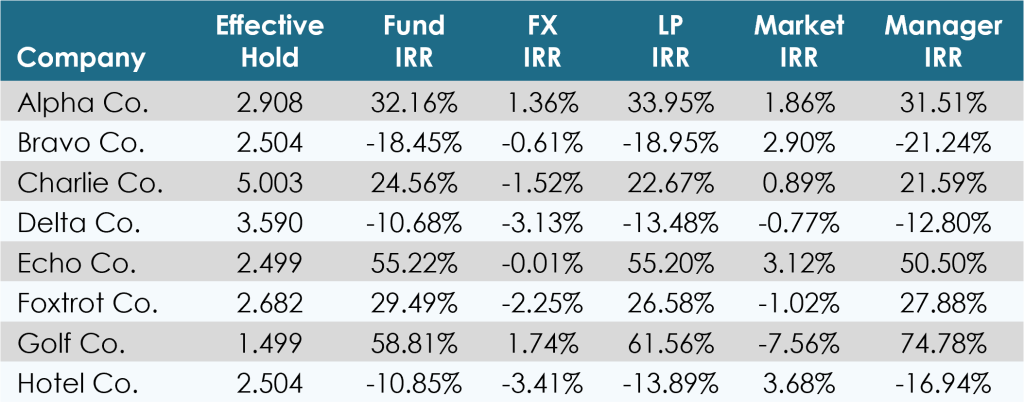
The IRR measurements above include:
- Fund IRR: The deal’s Gross IRR in the Fund’s currency of EUR.
- FX IRR: The estimated annualized impact of foreign exchange rate fluctuations over the holding period.
- LP IRR: The deal’s Gross IRR in the LP’s currency of USD.
- Market IRR: The estimated total annualized impact of foreign exchange rate, market valuation, and addressable market fluctuations over the holding period.
- Manager IRR: An estimate of the GP’s total, annualized value-add, after adjusting for the broader market forces included in the Market IRR.
Note that none of these IRR measurements are related to one another by addition or subtraction. Instead, they are related by multiplication and division. For example, the relationship between LP IRR, Market IRR, and Manager IRR can be expressed:
![\[ \left( 1 + LP\,IRR \right) = \left( 1+ Market\,IRR \right) \cdot \left(1 + Manager\,IRR \right) \]](https://valuebridge.net/wp-content/ql-cache/quicklatex.com-d0ab12da9b705adb5c15d2eca75d8fd5_l3.png "Rendered by QuickLaTeX.com")
Therefore, for Alpha Co:
![\[ \left( 1 + 33.95 \% \right) = \left( 1+ 1.86 \% \right) \cdot \left(1 + 31.51 \% \right) \]](https://valuebridge.net/wp-content/ql-cache/quicklatex.com-7adc289879356c113dad5390caf8f2d5_l3.png "Rendered by QuickLaTeX.com")
Resources
ValueBridge.net Modules
- 13. Market-driven Multiple Expansion
- 15. Market-driven Revenue Growth
- 19. Market versus Manager-driven Returns
- 20. The Market Return Matrix
- 21. Foreign Exchange Rates
Additional Resources
See the PME versus Value Creation, Market Valuation Multiples, and Addressable Market and Market Share videos and related content at AUXILIA Mathematica.
Please log in access additional content. Not a subscriber? Sign-up today!.