

Measure what really drives private equity returns, with 100+ Excel templates designed for numerous buyout, growth, and venture scenarios.
“ValueBridge.net helps busy private equity research analysts start building compelling value creation models in minutes.”
WHAT IS VALUEBRIDGE.NET?
Measure how private equity returns are driven by changes in portfolio company P&Ls, capital structures, and broader market conditions. Our private equity research templates work for investments that are levered or unlevered, buyout or growth, majority or minority, 10x or 0.1x. Best of all, they run on numbers that are usually already available in fund reporting and marketing materials.
Watch a 3-minute platform demonstration.
Analyst Edition subscriptions include full access to available video instruction, Excel templates, online calculators, module notes, references, case studies, community forums, and support.
Measure value driven by:
Company Performance
- EBITDA, gross profit, revenue
- Margins, operating expenses
Capital Structures
- Leverage effect, gearing
- Equity dilution
- Valuation
Broader Market Forces
- Market valuation multiples
- Addressable market changes
- Sector leverage levels
- Foreign exchange rates
Financing Activities
- Equity inflows and outflows
- Debt financing
- Add-on acquisitions
- Dividend recapitalizations
EXAMPLE: ESG-DRIVEN GAINS AND LOSSES
Quantify the equity return impact of any Environmental, Social, and Governance (ESG) initiative that has a measurable impact on portfolio company capital structure or P&L.
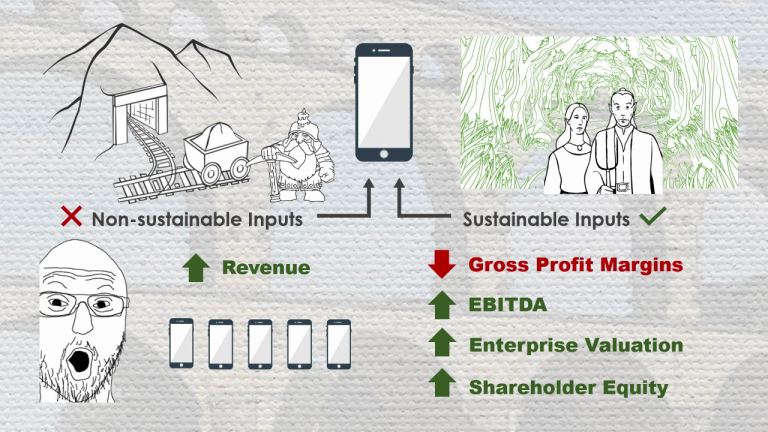
ESG Trade-offs: Margins vs. Revenue
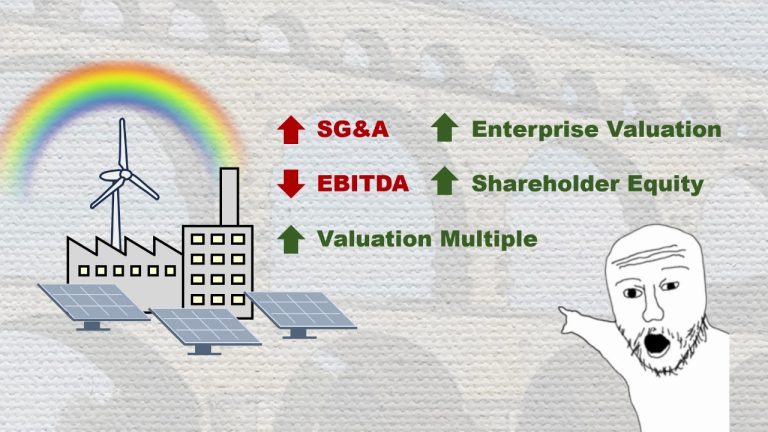
ESG Trade-offs: SG&A vs. Valuation
EXAMPLE: MARKET VS. MANAGER-DRIVEN RETURNS
Distinguish a Fund manager’s real value-add from broader market forces, like market valuation, addressable market, and foreign exchange rate changes. Create easier and more accurate alternatives to public market equivalence (PME), with market and economic data that is often available for little or no cost.
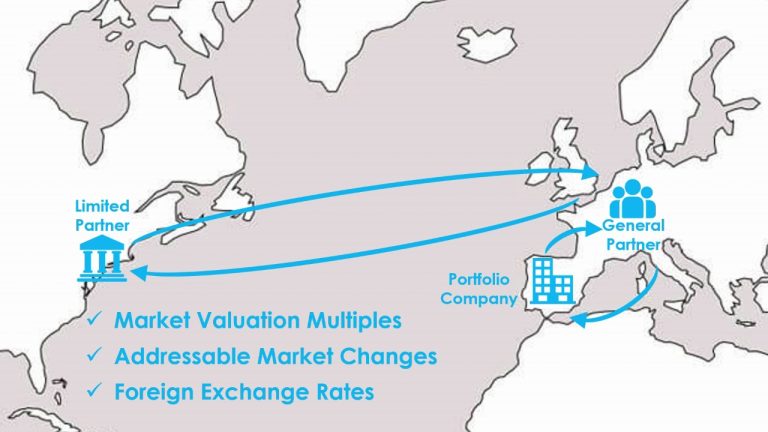
A Cross Border Value Bridge
Quick Cross Border Value Bridge
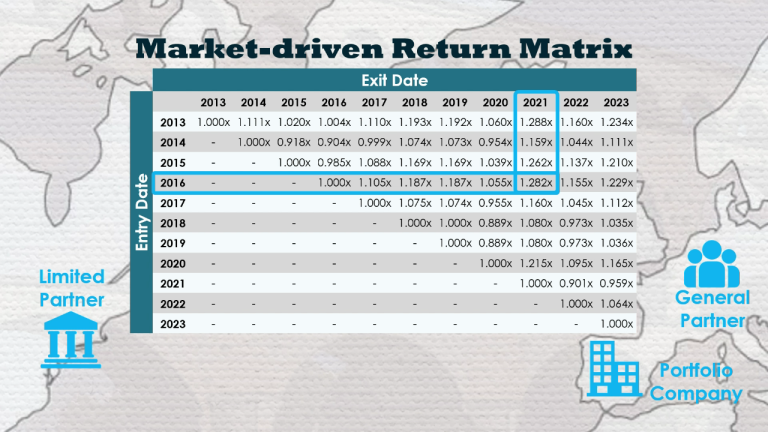
Cross Border Return Matrix
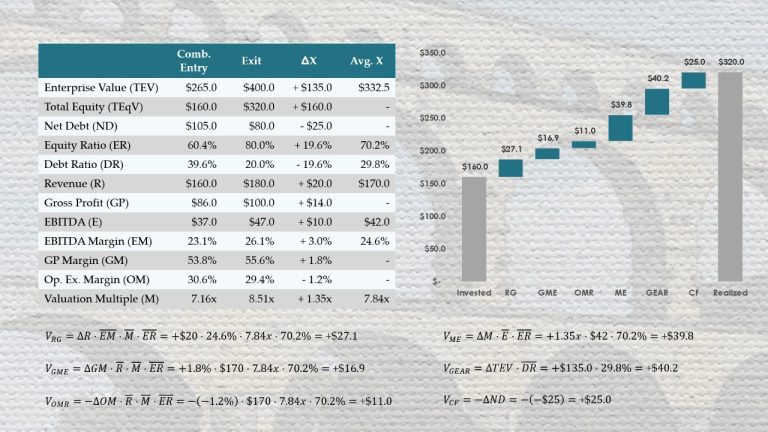
EXAMPLE: VALUE CREATION FUNDAMENTALS
Fix pervasive problems in value creation models that are commonly used by private equity investors, as well as academic and industry researchers.
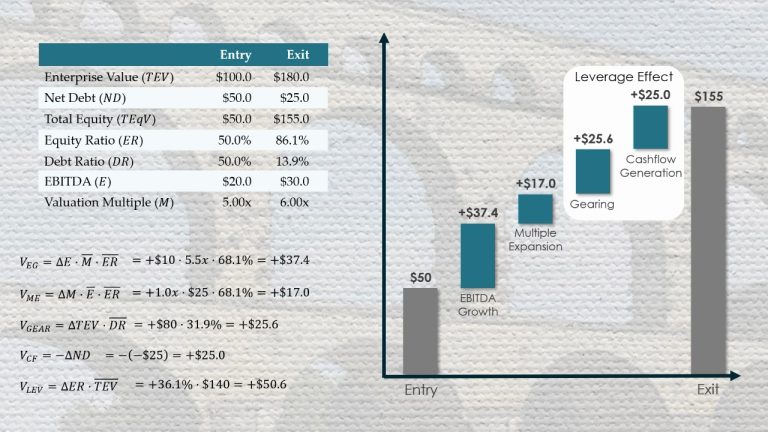
How to fix a broken value bridge
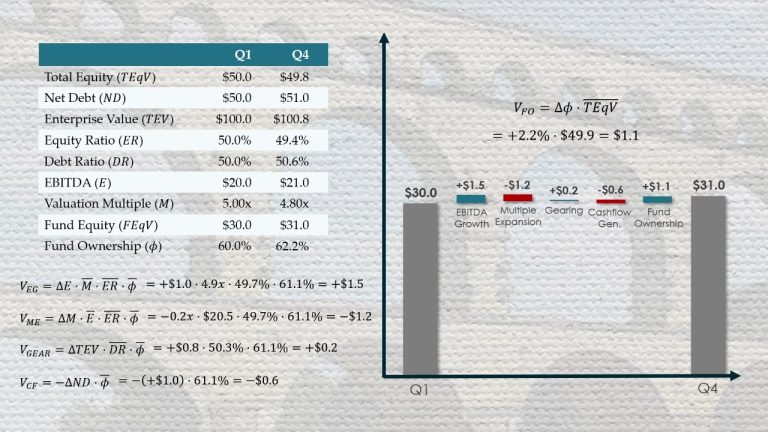
Why value bridges need an equity dilution or concentration value driver
HOW DOES VALUEBRIDGE.NET WORK?
Find the private equity research templates that are best suited to your application using the site’s search bar or filtering by categories and value creation metrics. Each module and case study includes detailed instructions, with step-by-step examples and resources that enable analysts to check their own spreadsheets for errors.
Video Instruction
Learn exactly which equations to use, where to find data, and how to set up your spreadsheets, all in about 5-6 minutes.
Excel Templates
Save time by starting with pre-built value creation templates that are already optimized for your application.
Online Calculators
Ensure that your models are correct by checking against the site’s fail-proof online value creation calculators.
Detailed Examples
No more guesswork due to step-by-step examples, clearly defined variables and equations, and links to proofs and further reading.
HOW DO THE MICROSOFT EXCEL TEMPLATES WORK?
Jumpstart your value creation models ValueBridge.net private equity research templates.
Watch a 5-minute Excel template demonstration.
How to start building private equity value creation models, immediately:
- Find the best Module or Case Study to use as a starting point
- Start on the right tab (EBITDA or revenue-base valuation)
- Only change the value creation inputs (independent variables)
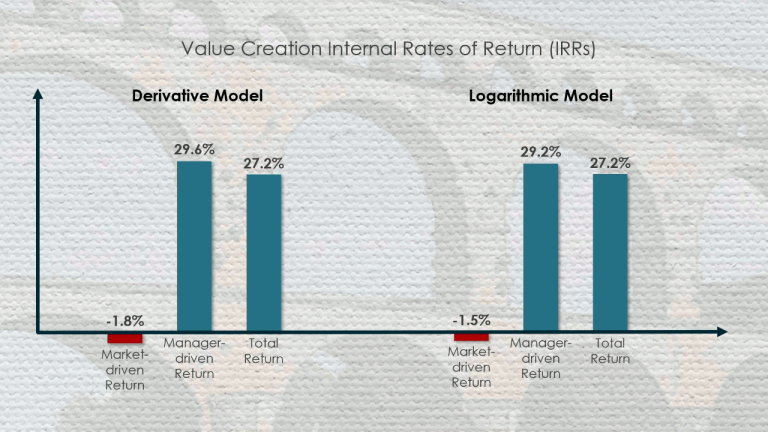
- Choose a value creation model (Derivative or Logarithmic)
- Pick one of five value creation measurements (absolute ($), relative (%), IRR, etc.)
- Customize the output (charts) to best tell your story
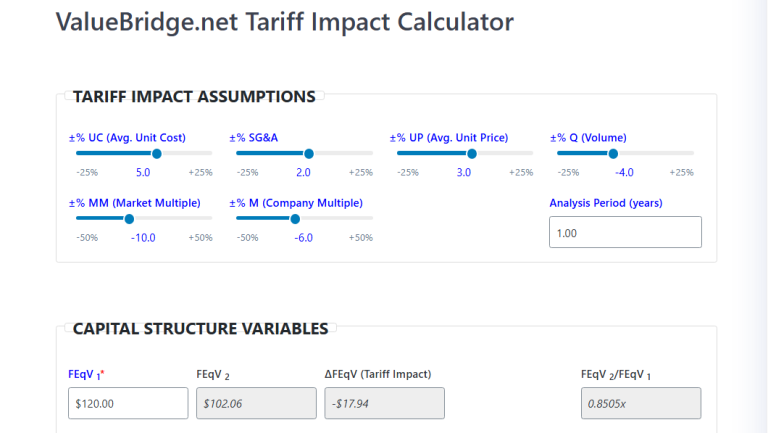
HOW DO THE ONLINE VALUE CREATION CALCULATORS WORK?
Online calculators perform the same math as the Excel templates, but they cannot be altered or broken through human error.
Watch a 5-minute online calculator demonstration.
Consider using the online calculators to occasionally spot-check your Excel models. Certainly do so before significant events, like including results in an Investment Committee Memo.
WHO ARE VALUEBRIDGE.NET SUBSCRIBERS?
Private equity research professionals, who need robust and reliable private equity research models, today!
General Partners
DIFFERENTIATE!
Raise more capital by telling better stories
Use data to show how your investment approach and value creation strategies drive returns.
Limited Partners
VALIDATE!
Make sure narratives are supported by numbers
Measure if GP initiatives materially impact portfolio company capital structures, P&Ls, and valuations.
Industry Researchers
CALCULATE!
Expand the universe of analyzable companies
Models rely on practical and accessible inputs that allow a larger number of companies to be analyzed.
WHAT DOES A VALUEBRIDGE.NET SUBSCRIPTION INCLUDE?
100% of available ValueBridge.net content, including video instruction, value creation templates, online calculators, module notes, references, case studies, community forums, and support.
Video
Instruction
Excel
Templates
Online
Calculators
Detailed
Examples
References
Case
Studies
Forums
Support
WHAT CONTENT IS CURRENTLY AVAILABLE?
Over 70% of content for the first 40 ValueBridge.net Modules is already complete. Nearly all the private equity research templates are available and written instruction, with step-by-step examples, has been provided for more than 90% of Modules. Video instruction is available for all the major value drivers related to investment performance, capital structures, and broader market forces. Additional content is being added every week, and most of the remaining material will be completed in 2024.
Module Component Availability
DOES A VALUEBRIDGE.NET SUBSCRIPTION INCLUDE SUPPORT?
ValueBridge.net intends to give analysts everything they need to solve a particular problem, but we may not get that right every time.
Subscribers can ask questions in the Forum or in the comments section of Case Studies. For problems and applications that are not yet covered by the site’s modules or Excel templates, subscribers can use the site’s Support features to contact us by email, telephone, Zoom, Meet, etc.
WHAT ARE VALUEBRIDGE.NET CASE STUDIES?
Case Studies highlight interesting applications of ValueBridge.net mathematics, as well as other platform features.
Non-subscribers can view some of the case study content, but active subscriptions are required to comment or download related value creation templates.
WHAT IS THE VALUEBRIDGE.NET FORUM?
The Forum section currently highlights updates that are being made to the site. Subscribers can access all forum content, create topics ask questions, and post replies, so this section may become more interesting as subscribers join the site.
WHO RUNS VALUEBRIDGE.NET?

Mike Reinard has been working with private equity GPs and institutional LPs for over 15 years. He helps fund managers tackle resource intensive financial analysis, marketing, fundraising, and investor relations projects (e.g., creating complex portfolio analyses, writing the next private placement memorandum, or building a custom direct deal sourcing software application, etc.).
Mike specializes in the mathematics of private equity. He wrote the book Private Equity Value Creation Analysis in 2020 and also runs the private equity mathematics website AUXILIA Mathematica.
WHAT IS PRIVATE EQUITY VALUE CREATION ANALYSIS?
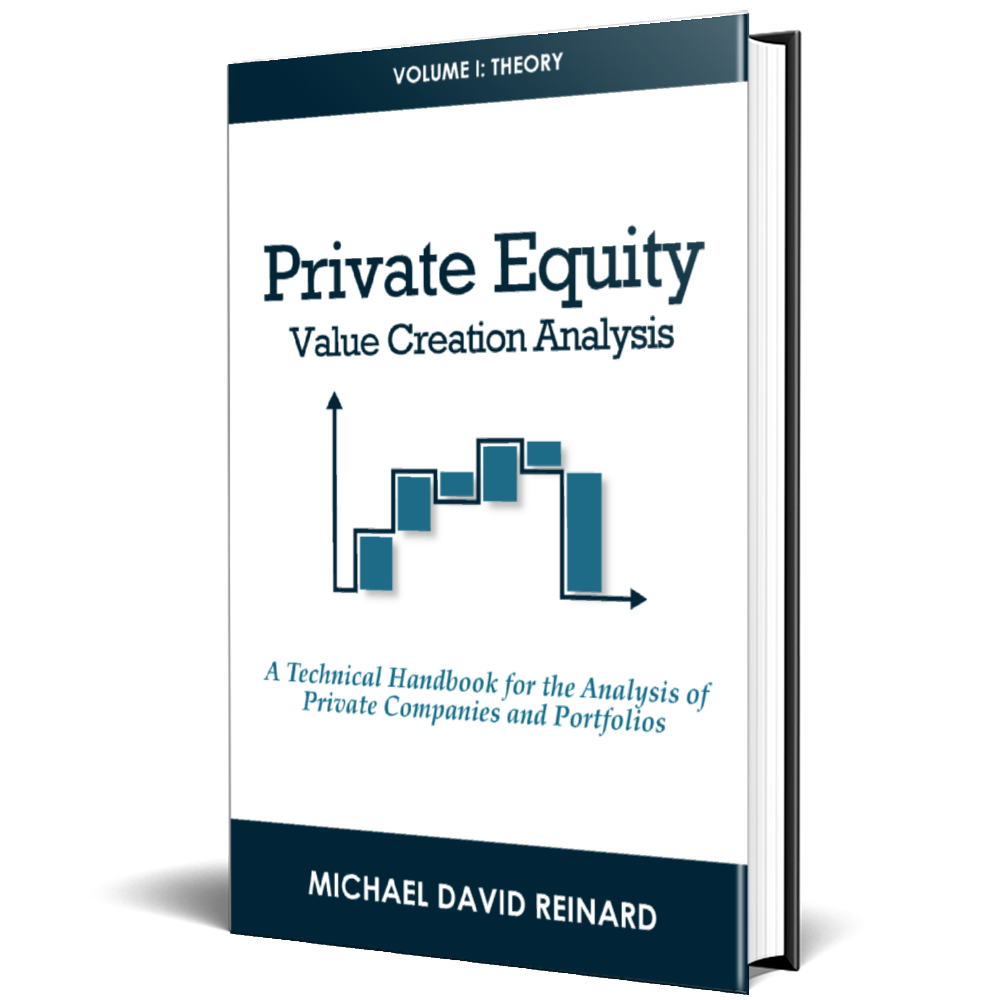
Published in 2020, Private Equity Value Creation Analysis is a top private equity book on Amazon.com. It is a comprehensive handbook for the analysis of private companies and portfolios. Its framework quantifies how leverage, valuation, company P&Ls, market and industry trends, and other factors drive equity returns. Such analyses are used by private equity and venture capital fund managers to explain their approaches to buying and selling companies and by institutional investors to validate them.
Specifically designed for the particularities of private equity ownership, the book’s value creation models are mathematically rigorous and based on metrics that are practical and accessible (i.e., those generally found in fund manager reporting and marketing materials). Formulas are built to function over the widest range of company, industry, and market conditions and provide intuitive and non-volatile results.
WHAT IS AUXILIA MATHEMATICA?
AUXILIA Mathematica was started as a private equity math blog in 2019. The articles, value creation templates, and online calculators initially posted there led to a rigorous mathematical framework that formed the basis of the book Private Equity Value Creation Analysis, published at the end of 2020.
Since 2021, AUXILIA Mathematica has been exploring and explaining the mathematics of private equity through video, on the site and AUXILIA Mathematica’s YouTube page. These videos describe the math in the book and additional applications, with a focus on proofs, derivations, and direct comparisons with other models used in academic and industry research.
HOW ARE VALUEBRIDGE.NET AND AUXILIA MATHEMATICA DIFFERENT?
ValueBridge.net is application-focused and subscription-based. Each of the 40 ValueBridge.net modules includes downloadable value creation templates, short video demonstrations, step-by-step examples, and online value creation calculators that test models for errors.
AUXILIA Mathematica is theory-focused and free with registration. Content often includes detailed proofs, derivations, and direct comparisons with other models used in academic and industry research. Excel templates and online value creation calculators are available for some (not all) topics on the site.
ValueBridge.net is designed for private equity analysts who want immediate results and generally lack the time or inclination to read a 240-page math book or spend five hours watching video on the AUXILIA Mathematica YouTube page.
HOW MUCH DOES A VALUEBRIDGE.NET SUBSCRIPTION COST?
Sign up for Analyst Edition pricing below:
- $25.00 USD per month, billed monthly
- $20.00 USD per month, billed quarterly ($60 USD per quarter)
- $15.00 USD per month, billed annually ($180 USD per year)
WILL MY SUBSCRIPTION AUTO-RENEW?
Yes. Your subscription will renew either monthly, quarterly, or annually, depending upon options chosen at sign-up. You can manage payment methods or cancel the subscription on your Account page.
CAN I CANCEL MY SUBSCRIPTION?
Yes, you can do so with one click on your Account page.